Fig. 5
Download original image
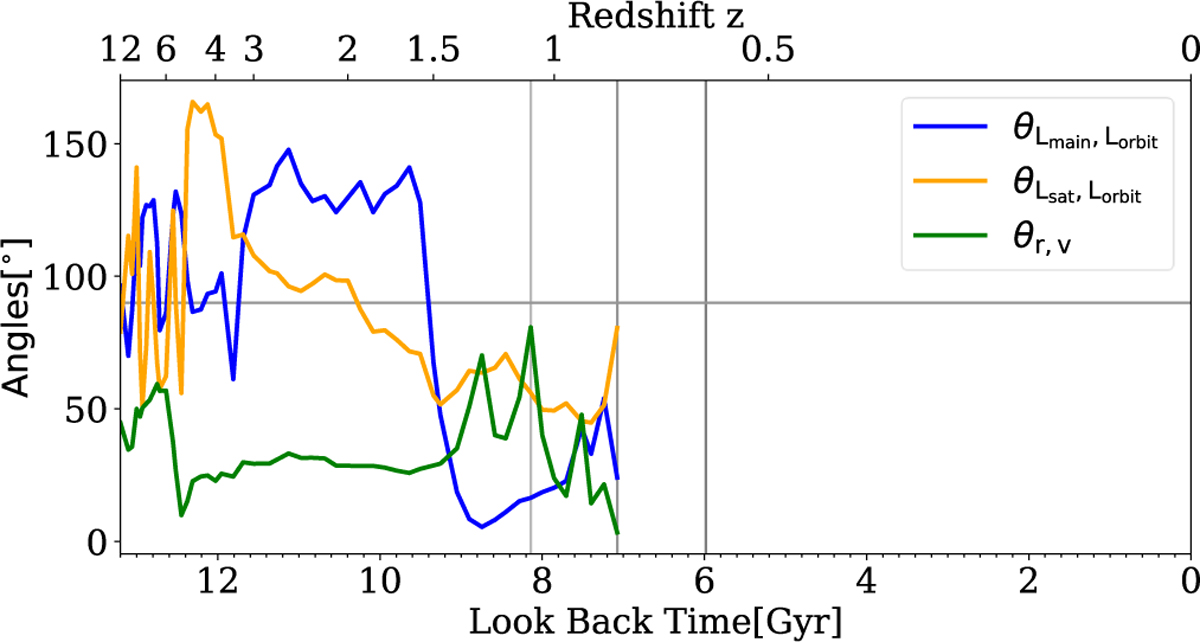
Illustration of the evolution of the three angles before and during the merger. θLmain, Lorbit, θLsat, Lorbit, and θr, v are represented by blue, orange, and green lines, respectively. The three gray vertical lines represent the merger time (tmerger) as well as 1 Gyr before (tmerger−1 Gyr) and 1 Gyr after (tmerger+1 Gyr) the merger, consistent with Fig. 1. The gray horizontal line represents 90°. The illustrated merger is the same pair as shown in Figs. 1 and 2.
Current usage metrics show cumulative count of Article Views (full-text article views including HTML views, PDF and ePub downloads, according to the available data) and Abstracts Views on Vision4Press platform.
Data correspond to usage on the plateform after 2015. The current usage metrics is available 48-96 hours after online publication and is updated daily on week days.
Initial download of the metrics may take a while.