Fig. 4
Download original image
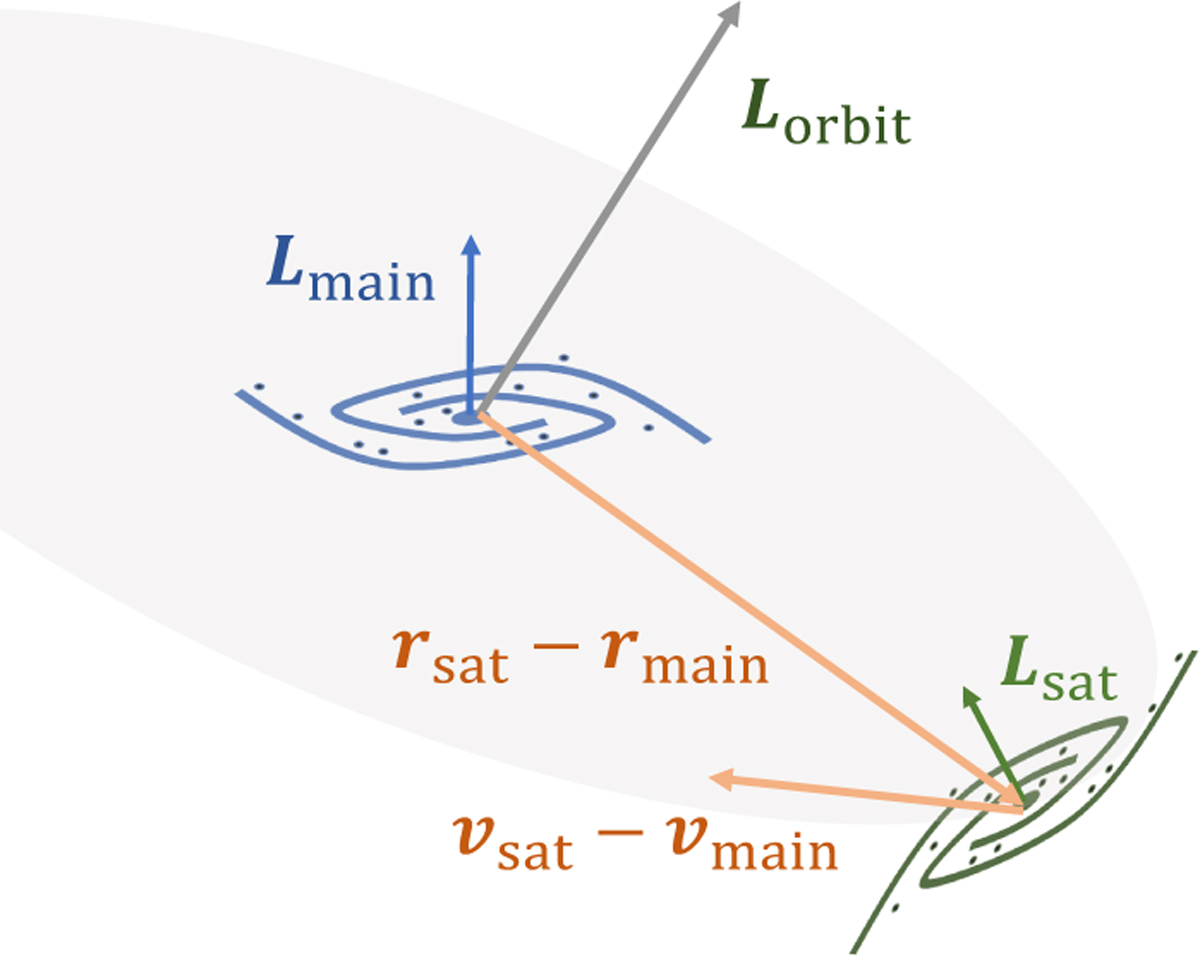
A diagram illustrating the relative position of two galaxies during the merger. The blue plane represents the main galaxy, while the green plane represents the satellite galaxy and the gray plane represents the orbital plane, with corresponding colored vectors indicating the spin directions. The two orange vectors represent the position and velocity of the satellite galaxy relative to the main galaxy. This diagram is adapted from Figure 5 in Martin et al. (2018).
Current usage metrics show cumulative count of Article Views (full-text article views including HTML views, PDF and ePub downloads, according to the available data) and Abstracts Views on Vision4Press platform.
Data correspond to usage on the plateform after 2015. The current usage metrics is available 48-96 hours after online publication and is updated daily on week days.
Initial download of the metrics may take a while.