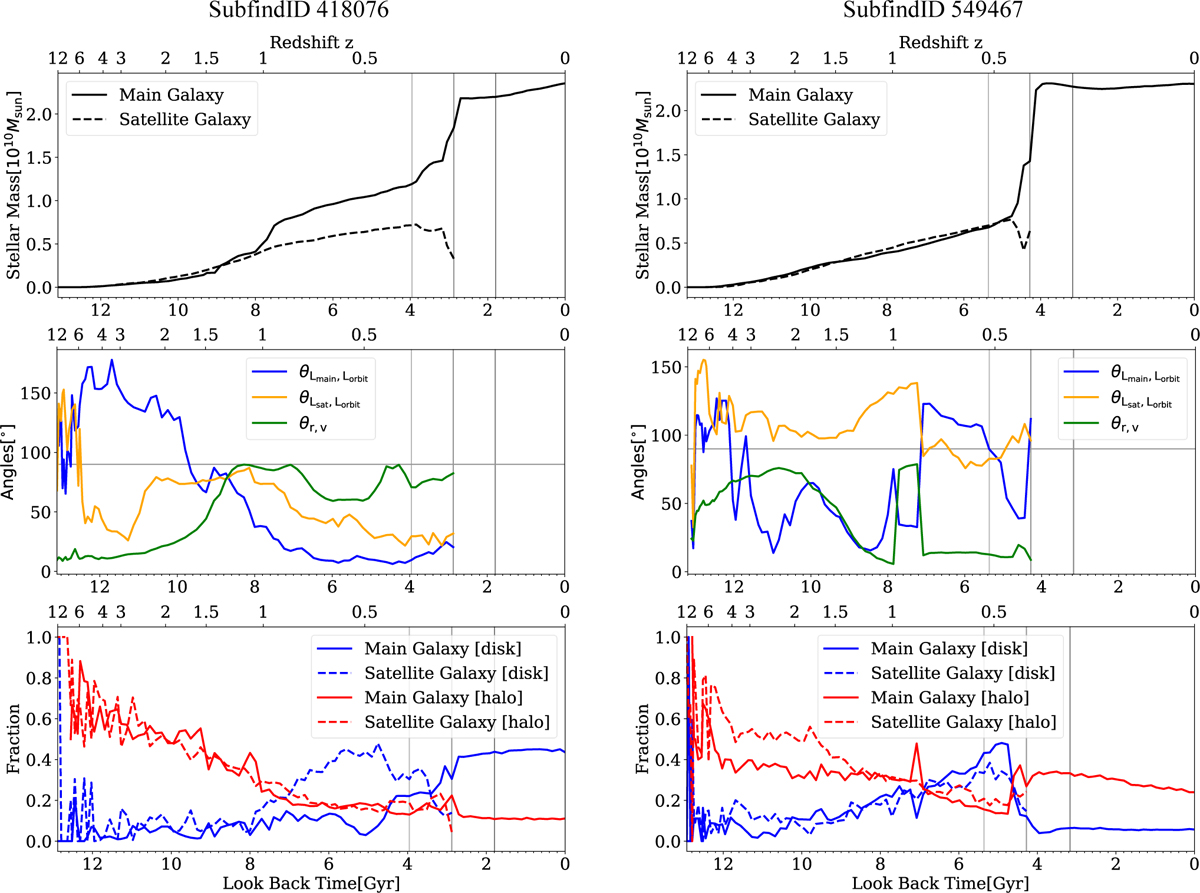
Fig. C.1
Download original image
Sublink tree of two typical cases in our sample, SubfindID 418076 and 549467 at snapshot 99, respectively. The top two rows of panels display stellar masses and angles over cosmic time, mirroring the format of Fig. 1 and Fig. 5. The bottom row of panels show the fraction of disk and hot inner stellar halo as a function of time. The red and blue lines represent the disk and hot inner stellar halo fractions, while solid lines depict the main galaxy and dashed lines represent the satellite galaxy.
Current usage metrics show cumulative count of Article Views (full-text article views including HTML views, PDF and ePub downloads, according to the available data) and Abstracts Views on Vision4Press platform.
Data correspond to usage on the plateform after 2015. The current usage metrics is available 48-96 hours after online publication and is updated daily on week days.
Initial download of the metrics may take a while.