Open Access
Fig. A.1
Download original image
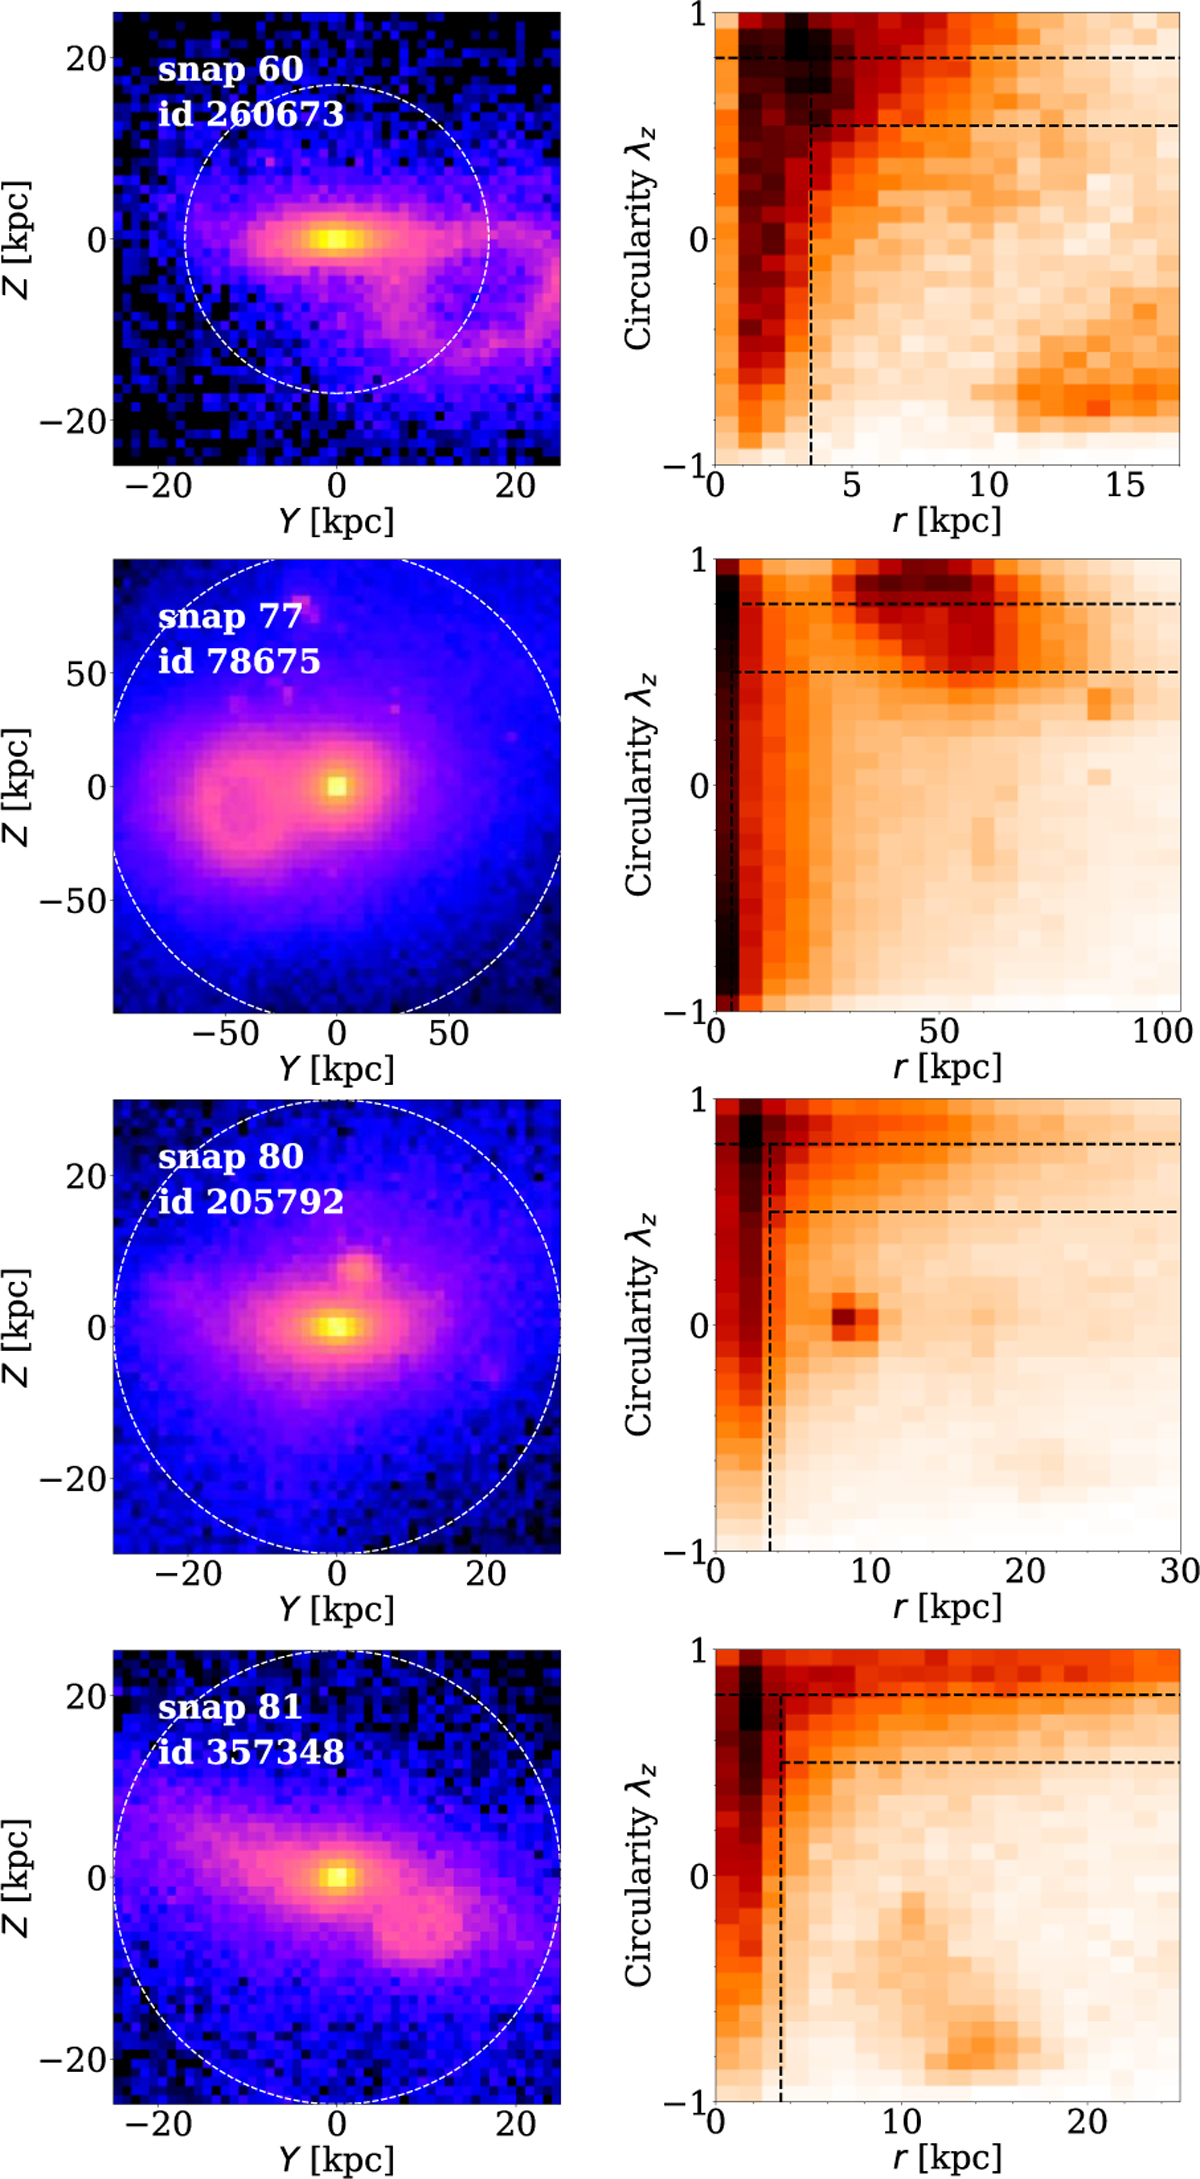
Y-Z projection images as well as λz-r phase spaces of representative manually excluded samples mentioned in Section 2.3. This figure follows the same plotting convention as Fig. 2. Both the image and λz-r phase space diagrams reveal clear substructures, indicating these systems are not in dynamical equilibrium.
Current usage metrics show cumulative count of Article Views (full-text article views including HTML views, PDF and ePub downloads, according to the available data) and Abstracts Views on Vision4Press platform.
Data correspond to usage on the plateform after 2015. The current usage metrics is available 48-96 hours after online publication and is updated daily on week days.
Initial download of the metrics may take a while.