Fig. 9
Download original image
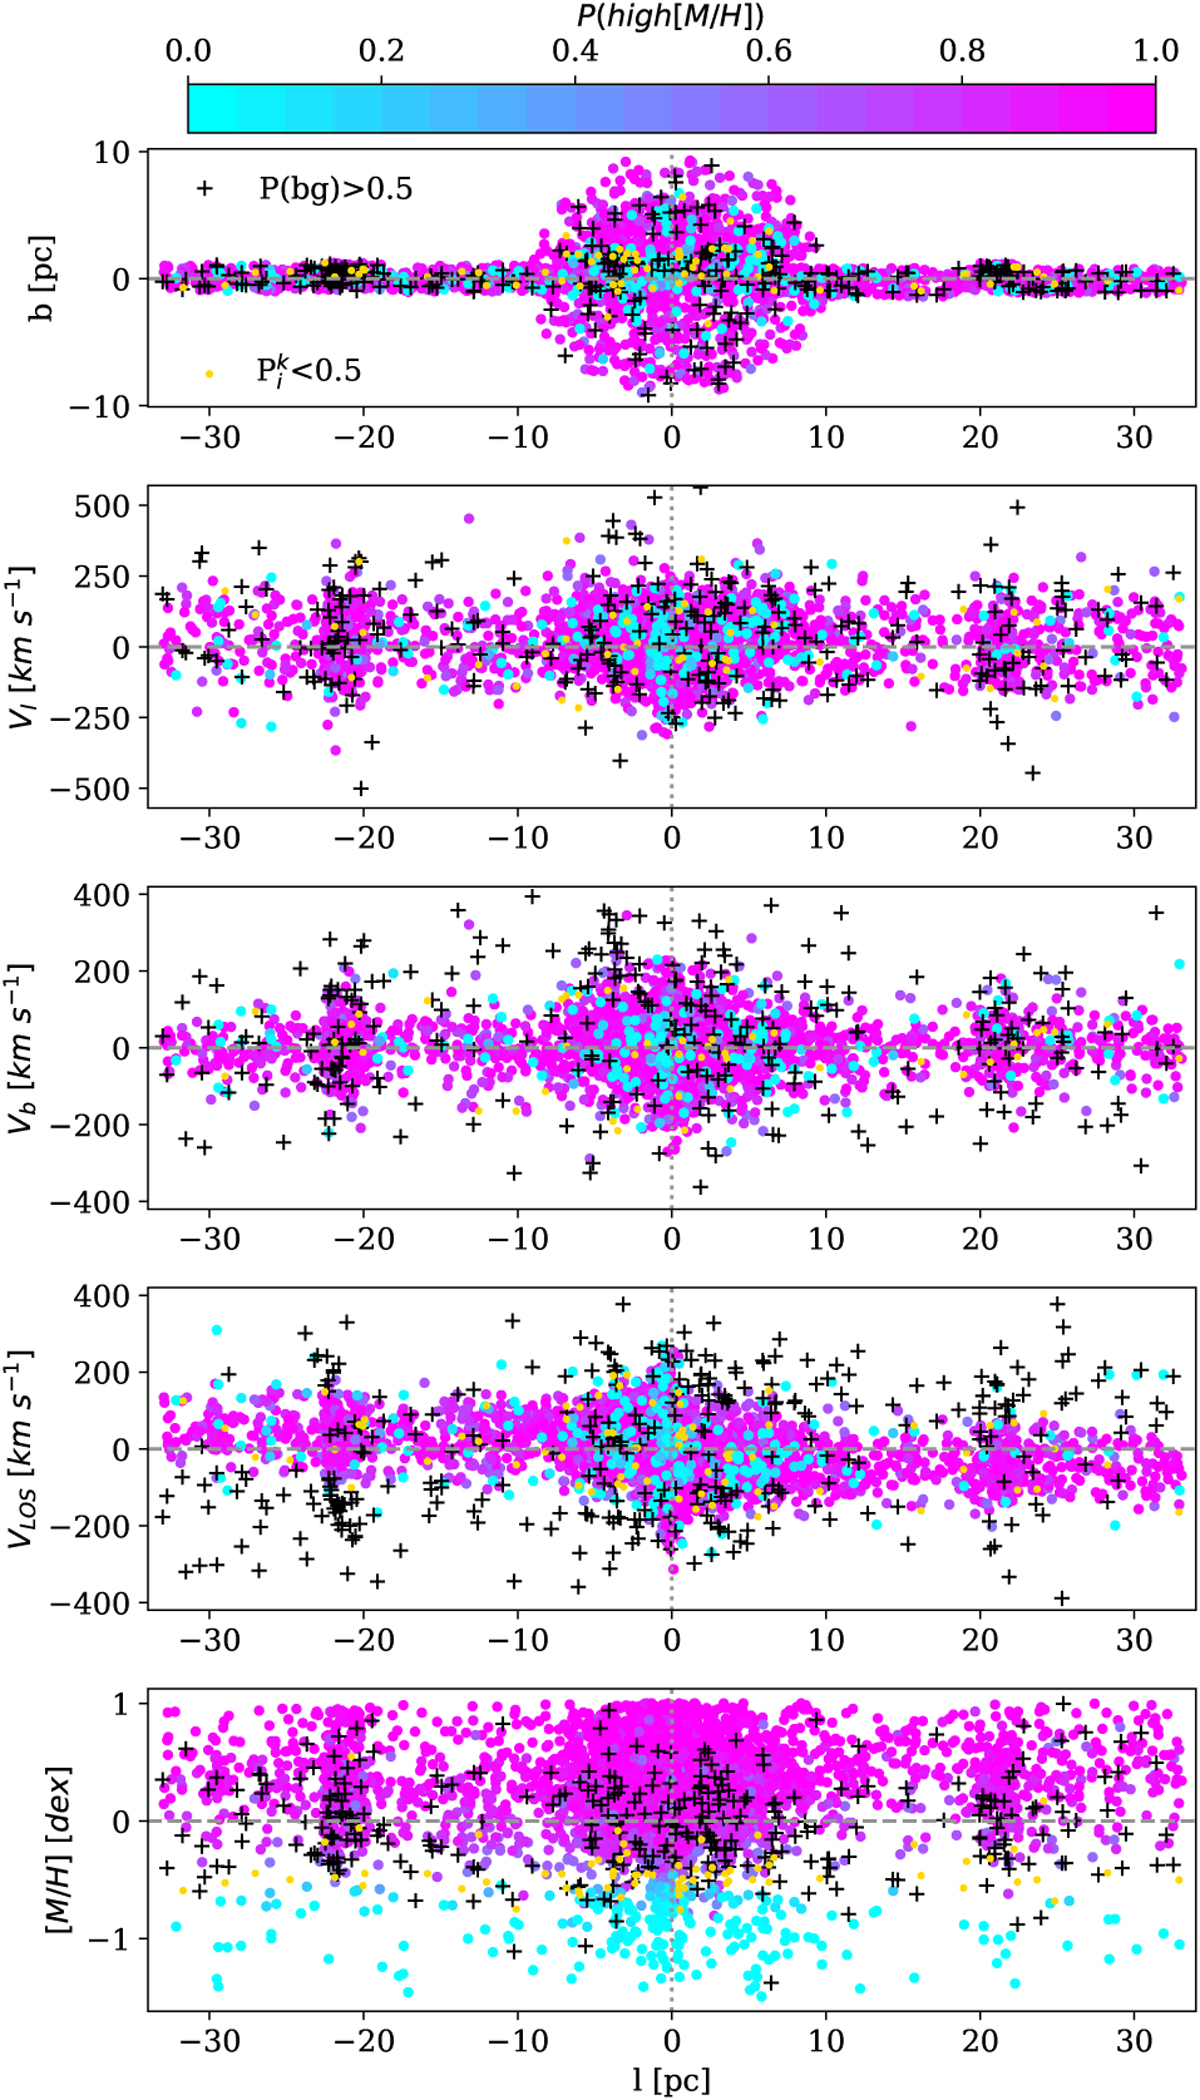
Map of the stellar positions (top), position-velocity plots along the Galactic longitude l for the PM along l (second panel), along b (third panel), along the line of sight (fourth panel), and along the stellar metallicity [M/H]. The colour-coding is from the 50th percentile realisation of the two-population model and is shown by the colour bar on the top. Pink denotes a high probability to be a high [M/H] star, cyan shows a low [M/H] star, and the black plus shows a background star. The orange circles denote stars with a population membership probability ![]() .
.
Current usage metrics show cumulative count of Article Views (full-text article views including HTML views, PDF and ePub downloads, according to the available data) and Abstracts Views on Vision4Press platform.
Data correspond to usage on the plateform after 2015. The current usage metrics is available 48-96 hours after online publication and is updated daily on week days.
Initial download of the metrics may take a while.