Open Access
Fig. 8
Download original image
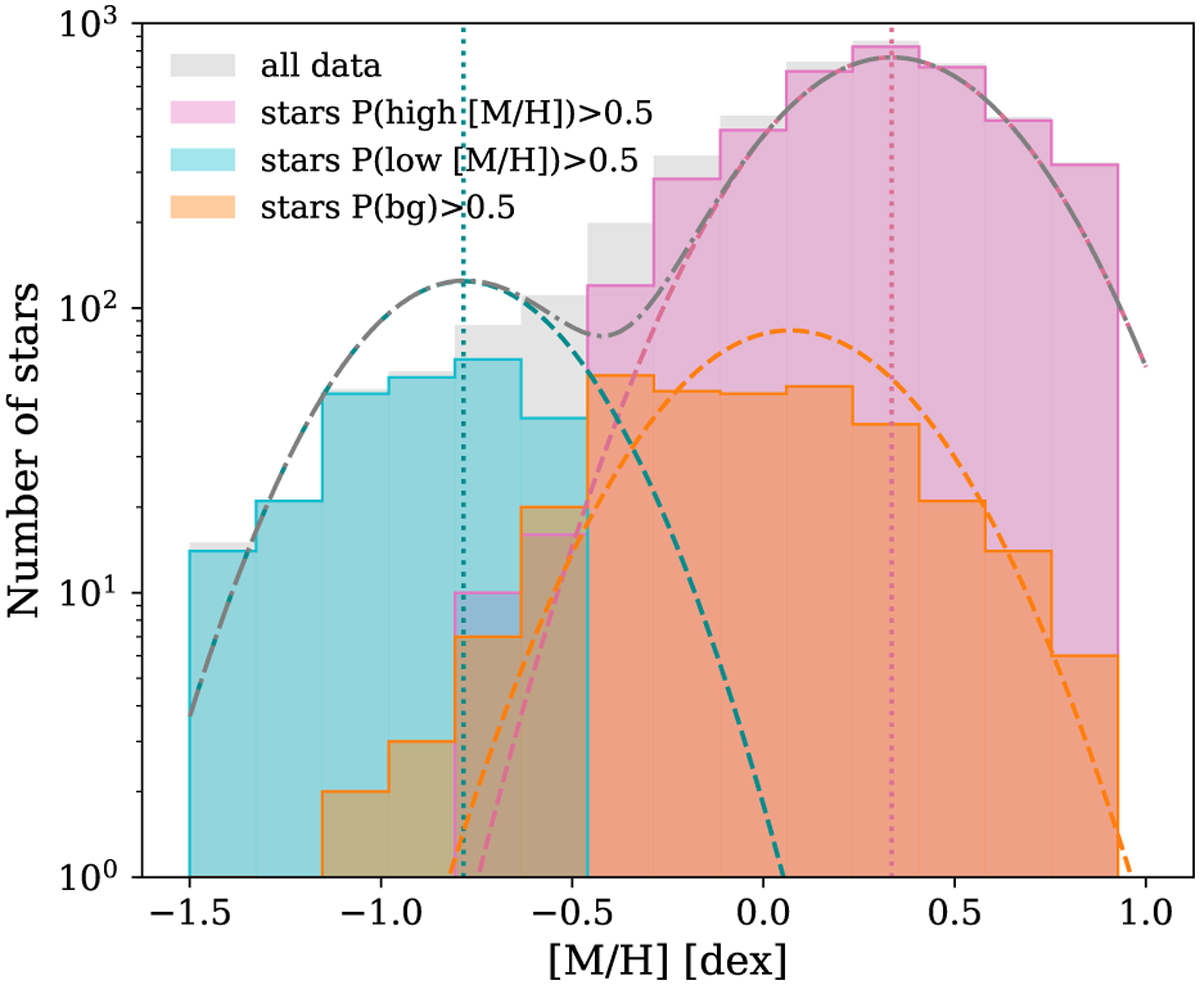
[M/H] histogram. The grey histogram denotes all stars, the vertical dotted lines show the 50th percentile of Zk, and the dashed lines represent the resulting distributions of Zk and ![]() . Pink denotes the high[M/H] population, cyan shows the low-[M/H] population, and orange shows the background population.
. Pink denotes the high[M/H] population, cyan shows the low-[M/H] population, and orange shows the background population.
Current usage metrics show cumulative count of Article Views (full-text article views including HTML views, PDF and ePub downloads, according to the available data) and Abstracts Views on Vision4Press platform.
Data correspond to usage on the plateform after 2015. The current usage metrics is available 48-96 hours after online publication and is updated daily on week days.
Initial download of the metrics may take a while.