Fig. 3
Download original image
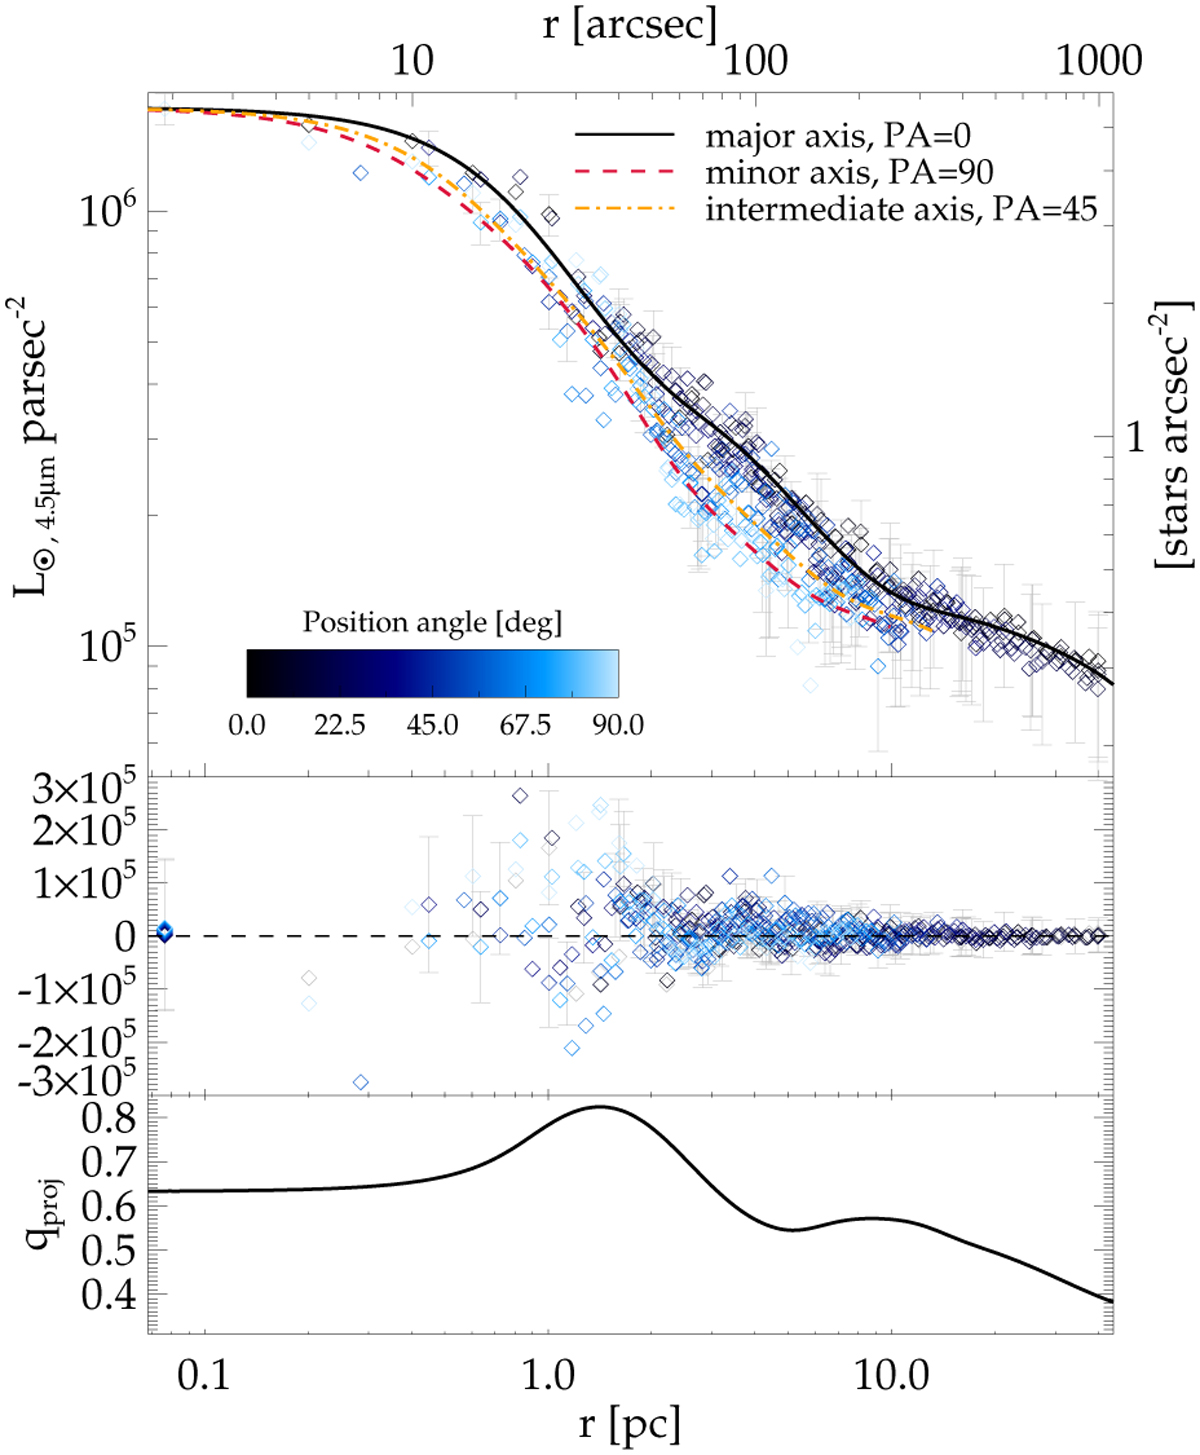
Upper panel: surface density profile derived from the stellar density maps of Gallego-Cano et al. (2020, blue diamonds). The uncertainties are measured using the corresponding uncertainty map and are only shown for a subset of data points to improve visibility. We matched the profile to the centre value of Feldmeier-Krause et al. (2017b) to convert it into units of L⊙ pc−2. The solid black line denotes the profile along the major axis, the dashed red line shows the profile along the minor axis, and the dot-dashed orange line shows the profile along a position angle of 45°. Middle panel: residuals of the star count data after subtracting the MGE fit. Lower panel: projected axis ratio qproj.
Current usage metrics show cumulative count of Article Views (full-text article views including HTML views, PDF and ePub downloads, according to the available data) and Abstracts Views on Vision4Press platform.
Data correspond to usage on the plateform after 2015. The current usage metrics is available 48-96 hours after online publication and is updated daily on week days.
Initial download of the metrics may take a while.