Fig. A.1
Download original image
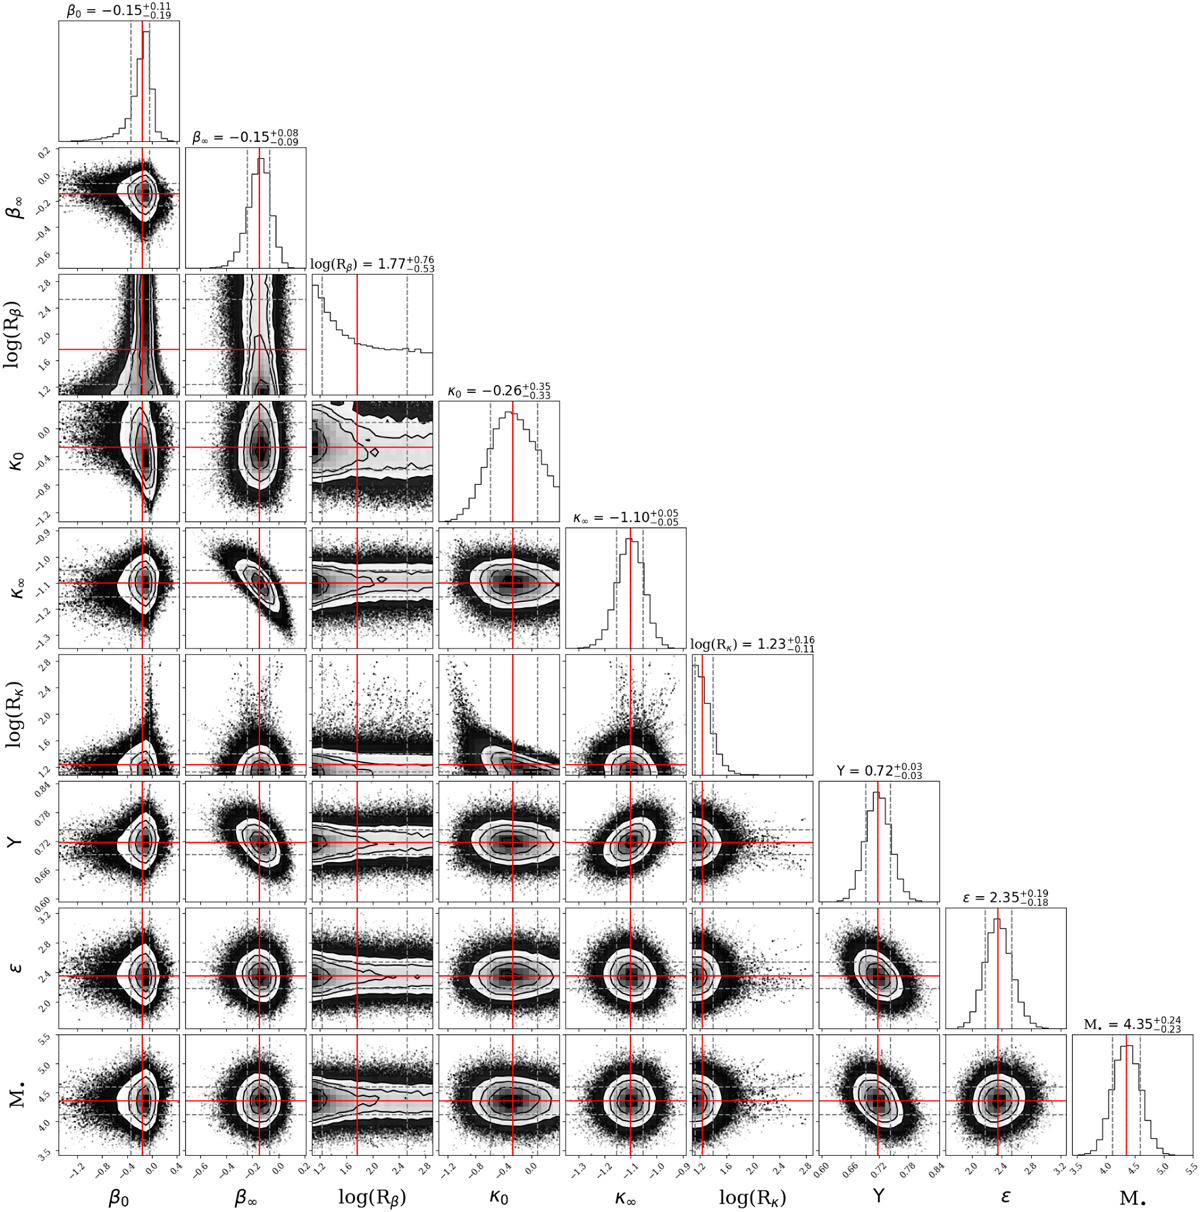
MCMC post burn-in distributions for the one-population models with M• as free parameter (Sect. 4.1). The scatter plots show the projected two-dimensional distributions, the red lines the respective 50th percentile, and the dashed grey lines the 16th and 84th percentiles. Their values are also written on top of each column, displaying the projected one-dimensional distributions. From top to bottom and left to right, the panels show the inner anisotropy β0, outer anisotropy β∞, the anisotropy transition radius log(Rβ), inner rotation parameter κ0, outer rotation parameter κ∞, the rotation transition radius log(Rκ), the mass-to-light ratio 𝚼, fraction of background stars ϵ in percent, and the black hole mass M• in 106 M⊙.
Current usage metrics show cumulative count of Article Views (full-text article views including HTML views, PDF and ePub downloads, according to the available data) and Abstracts Views on Vision4Press platform.
Data correspond to usage on the plateform after 2015. The current usage metrics is available 48-96 hours after online publication and is updated daily on week days.
Initial download of the metrics may take a while.