Fig. 9.
Download original image
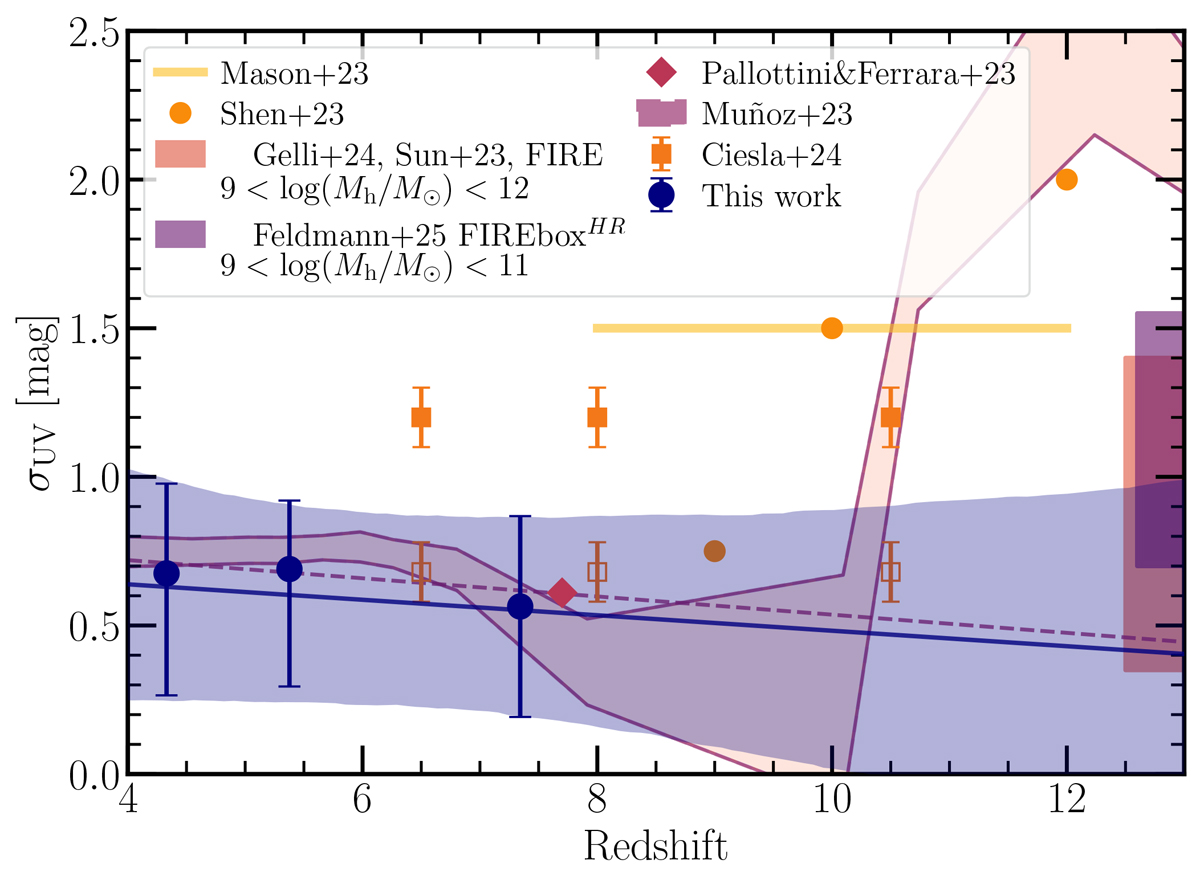
Scatter in the MUV−Mh relation, represented as σUV, as a function of redshift. The blue points with errorbars mark σUV at the median redshift of our three line emitter samples, while the blue line and envelope mark the best-fit and 1σ uncertainty as a linear function of redshift. From the literature compilation, the colored boxes at the right axis show the σUV for a range of Mh independent of redshift from the FIRE and FIREBOXHR simulations (Sun et al. 2023; Feldmann et al. 2025). For Muñoz et al. (2023), we show the 1σ contours for σUV obtained for independent z-bin fits; while the dashed purple line shows their best-fit linear function with redshift. For Ciesla et al. (2024) we show results from two different methods in the filled and empty squares.
Current usage metrics show cumulative count of Article Views (full-text article views including HTML views, PDF and ePub downloads, according to the available data) and Abstracts Views on Vision4Press platform.
Data correspond to usage on the plateform after 2015. The current usage metrics is available 48-96 hours after online publication and is updated daily on week days.
Initial download of the metrics may take a while.