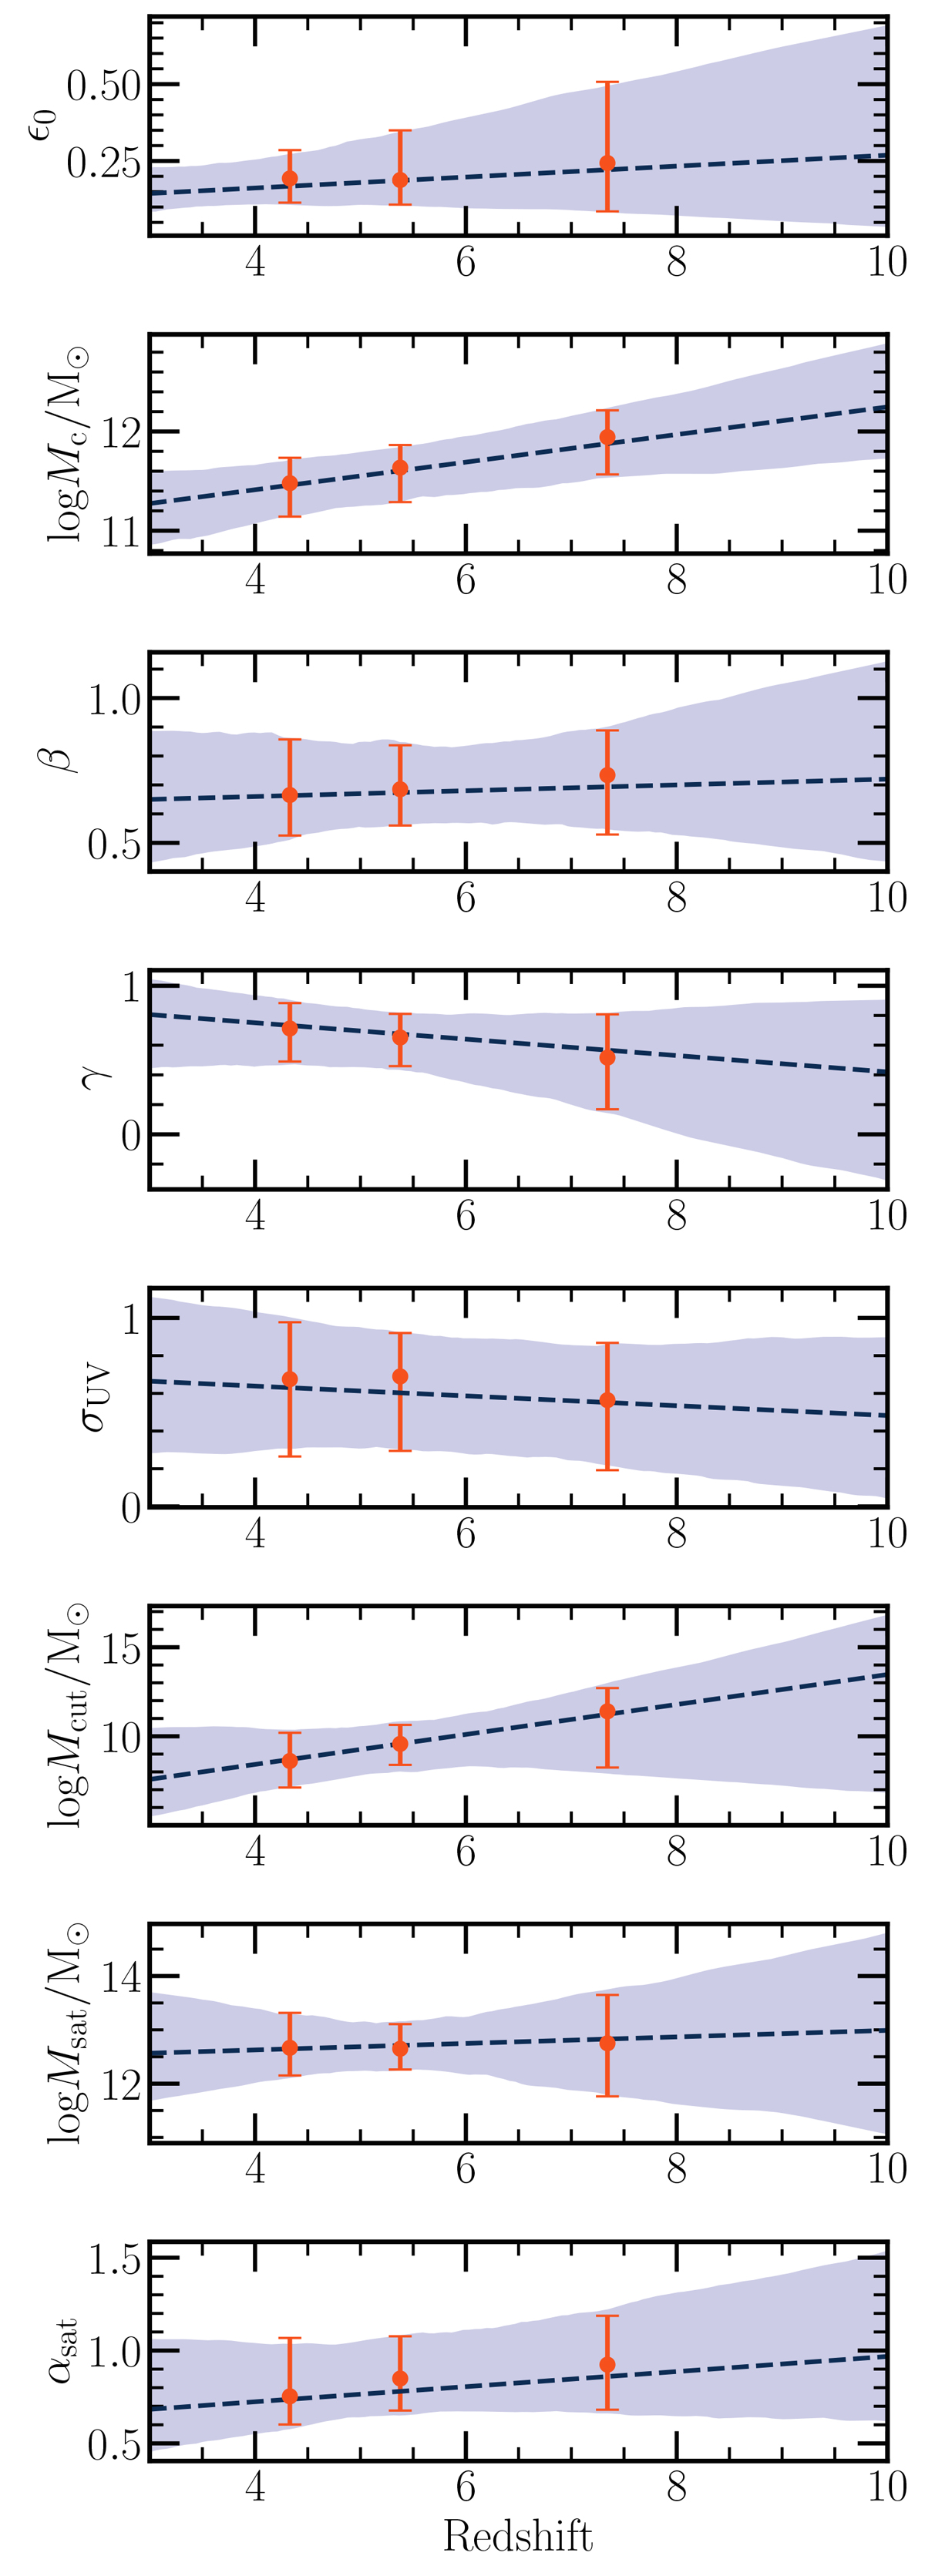
Fig. 8.
Download original image
Resulting values of the model parameters. These values were obtained by drawing 1000 samples from the posterior and evaluating the models at a given z using Eq. (18). The orange points and errorbars mark the redshift bins of the 2PCF measurements. The dashed lines mark the z-parametrized functions (Eq. (18)) for our model parameters, evaluated at the median posterior.
Current usage metrics show cumulative count of Article Views (full-text article views including HTML views, PDF and ePub downloads, according to the available data) and Abstracts Views on Vision4Press platform.
Data correspond to usage on the plateform after 2015. The current usage metrics is available 48-96 hours after online publication and is updated daily on week days.
Initial download of the metrics may take a while.