Fig. 3.
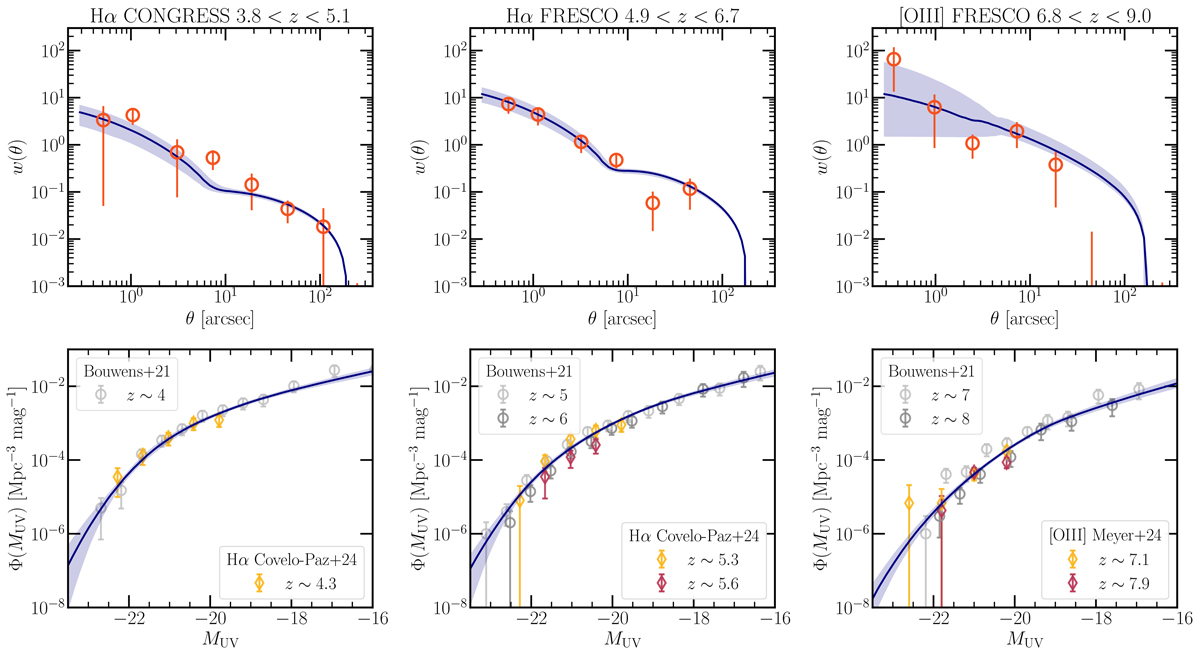
Download original image
Best-fit models of the 2PCF and UVLF. Top row: Angular 2PCF measured from the Hα CONGRESS and FRESCO samples at z ∼ 4.3 and z ∼ 5.4 and [O III] sample at z ∼ 7.3 (orange points). Bottom row: UVLF for the same line emitter samples from Covelo-Paz et al. (2025), Meyer et al. (2024) along with the photometrically selected samples from Bouwens et al. (2021). The blue curves and envelopes show the median models and 1σ uncertainty computed from the posterior. In the case of the UVLF, for simplicity we show only the models in the same redshift bins as the 2PCF measurements. We show the individual fits for each measurement in Fig. C.1.
Current usage metrics show cumulative count of Article Views (full-text article views including HTML views, PDF and ePub downloads, according to the available data) and Abstracts Views on Vision4Press platform.
Data correspond to usage on the plateform after 2015. The current usage metrics is available 48-96 hours after online publication and is updated daily on week days.
Initial download of the metrics may take a while.