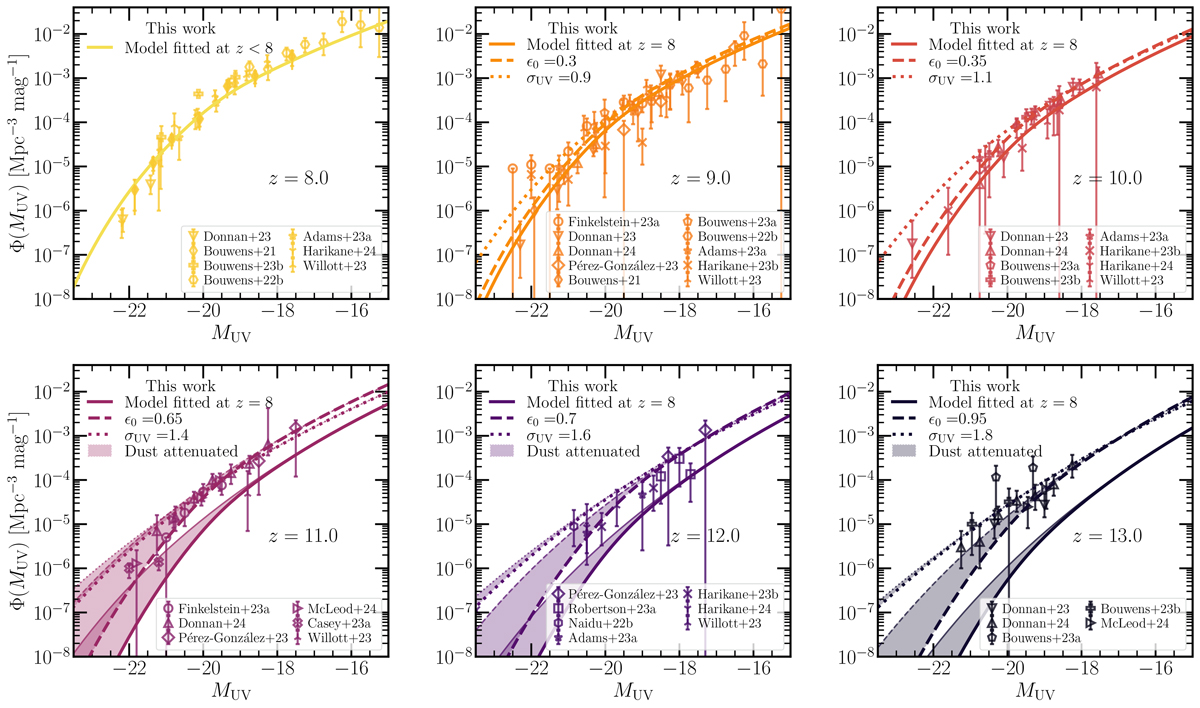
Fig. 10.
Download original image
Predictions of UVLF out to z = 13 from our model constrained on z < 8 data and compared to measurements from the literature. The solid lines correspond to the model evaluated at different redshifts from the best-fit linear redshift dependence of the model parameters fit on 4 ≲ z ≲ 8 data. The dashed and dotted lines illustrate the two extreme scenarios of increasing SFE versus increasing stochasticity and show the model where we tune by hand ϵ0 and σUV to approximately match the observations, while keeping the other parameters nominal. The filled area shows the effect of dust attenuation on the UVLF, with the upper thin lines marking the unatenuated UVLF.
Current usage metrics show cumulative count of Article Views (full-text article views including HTML views, PDF and ePub downloads, according to the available data) and Abstracts Views on Vision4Press platform.
Data correspond to usage on the plateform after 2015. The current usage metrics is available 48-96 hours after online publication and is updated daily on week days.
Initial download of the metrics may take a while.