Open Access
Fig. 8.
Download original image
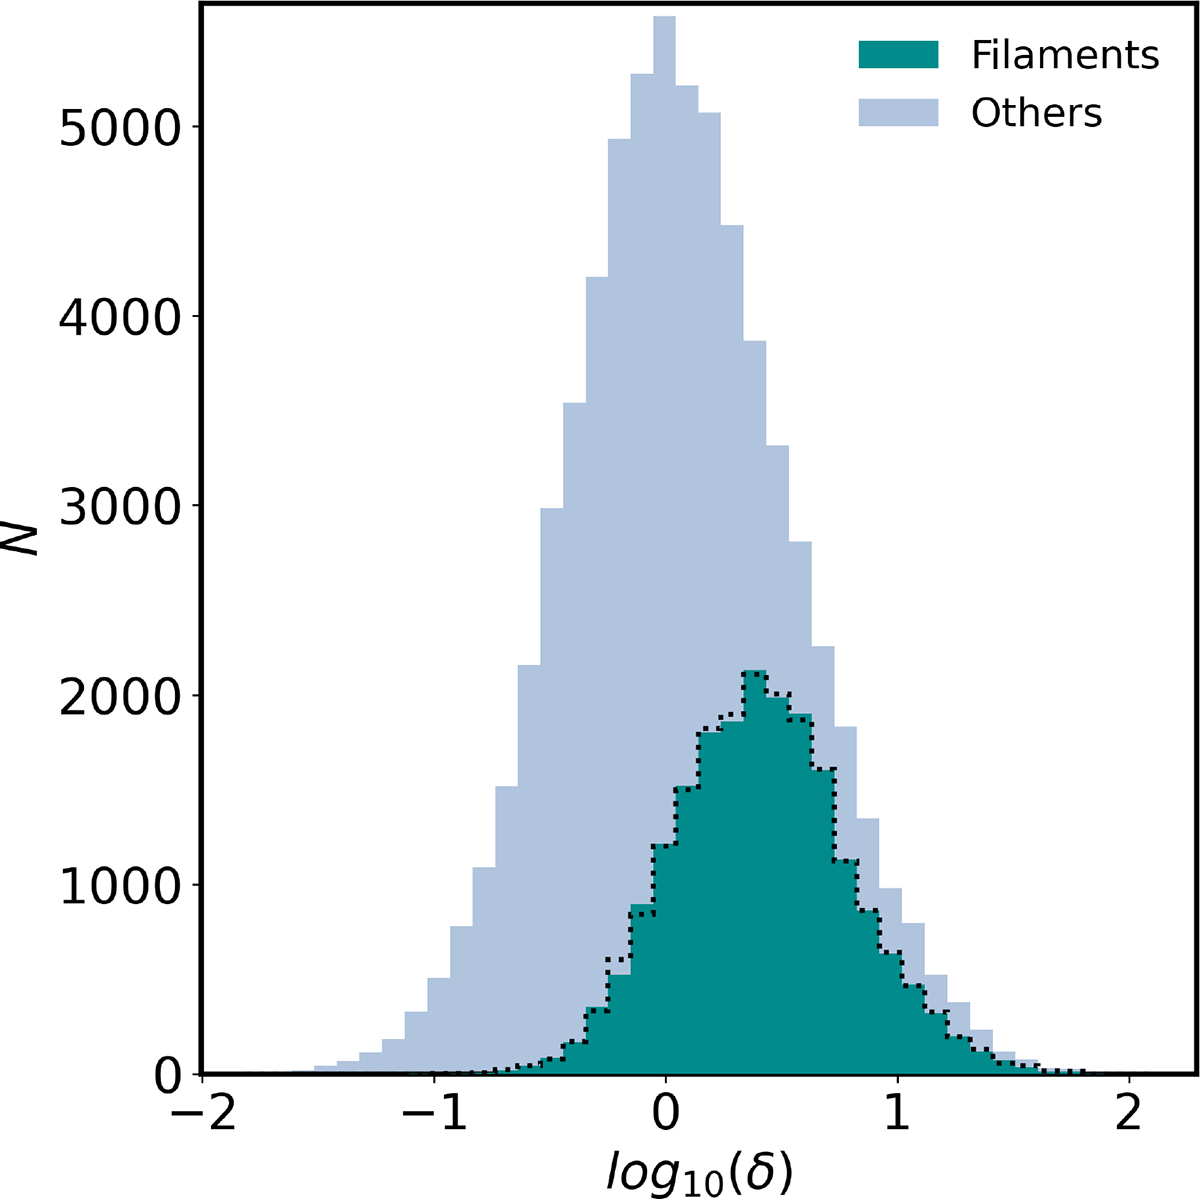
Local density distribution at 5 Mpc for central galaxies found in filaments and those classified as others. The dotted line represents the distribution of galaxies selected from the others that correspond to those in filaments.
Current usage metrics show cumulative count of Article Views (full-text article views including HTML views, PDF and ePub downloads, according to the available data) and Abstracts Views on Vision4Press platform.
Data correspond to usage on the plateform after 2015. The current usage metrics is available 48-96 hours after online publication and is updated daily on week days.
Initial download of the metrics may take a while.