Fig. 6.
Download original image
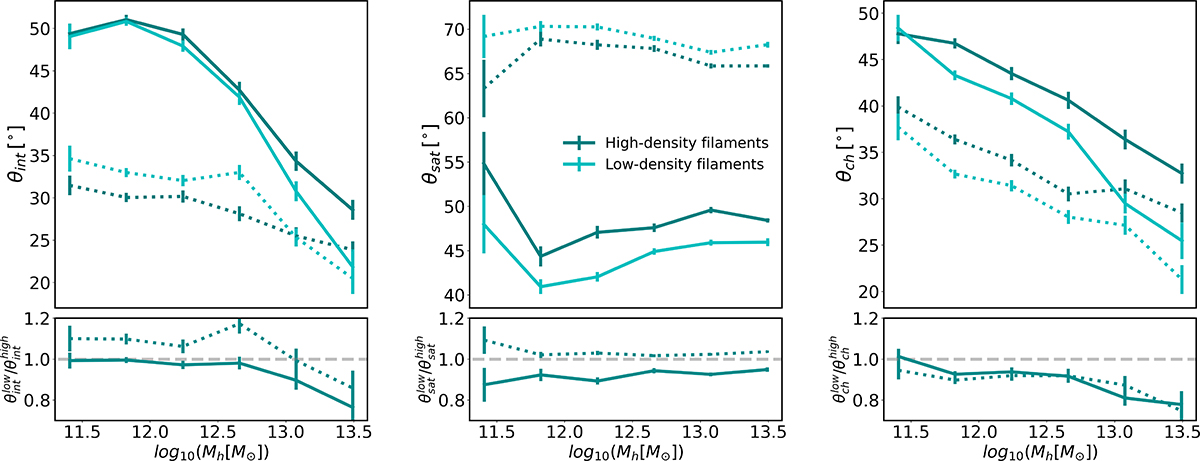
Dependence on halo mass the angles θint (left), θsat (centre), and θch (right) for central galaxies located in filaments of varying densities. Darker lines represent the highest density quartile, while lighter lines correspond to the lowest. In all panels, solid lines represent the major axis, while dotted lines represent the minor axis. The lower panels show the ratio between the results at different densities.
Current usage metrics show cumulative count of Article Views (full-text article views including HTML views, PDF and ePub downloads, according to the available data) and Abstracts Views on Vision4Press platform.
Data correspond to usage on the plateform after 2015. The current usage metrics is available 48-96 hours after online publication and is updated daily on week days.
Initial download of the metrics may take a while.