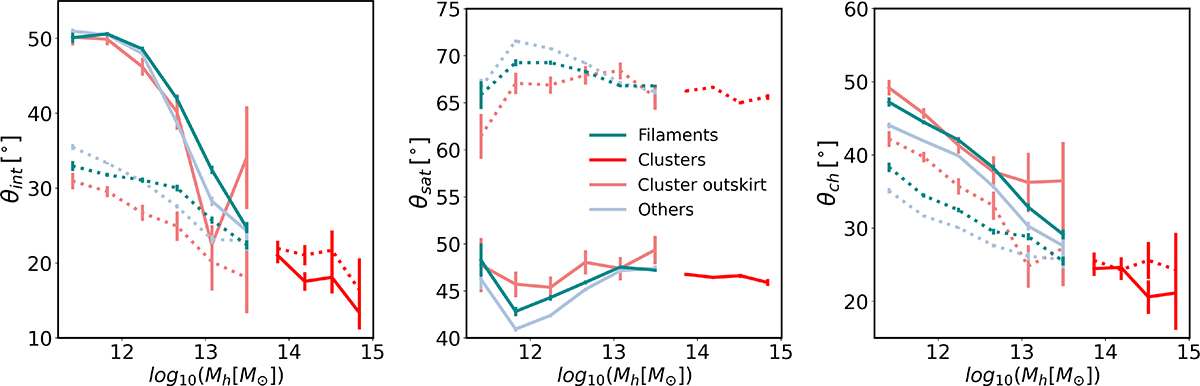
Fig. 4.
Download original image
Relation between the alignment of central galaxies and the mass of the halos in which they are located across different large-scale environments. The left, centre, and right panels illustrate this relationship for angles θint, θsat, and θch, respectively. In all panels, solid lines indicate the major axis, while dotted lines represent the minor axis. The lines shown in green, red, pink, and light blue correspond to halos in filaments, clusters, cluster outskirts, and other environments, respectively. The axes were measured using the DM particles and error bars were calculated using the standard deviation of the mean. In all panels, solid lines represent the major axis, while dotted lines represent the minor axis.
Current usage metrics show cumulative count of Article Views (full-text article views including HTML views, PDF and ePub downloads, according to the available data) and Abstracts Views on Vision4Press platform.
Data correspond to usage on the plateform after 2015. The current usage metrics is available 48-96 hours after online publication and is updated daily on week days.
Initial download of the metrics may take a while.