Fig. 3.
Download original image
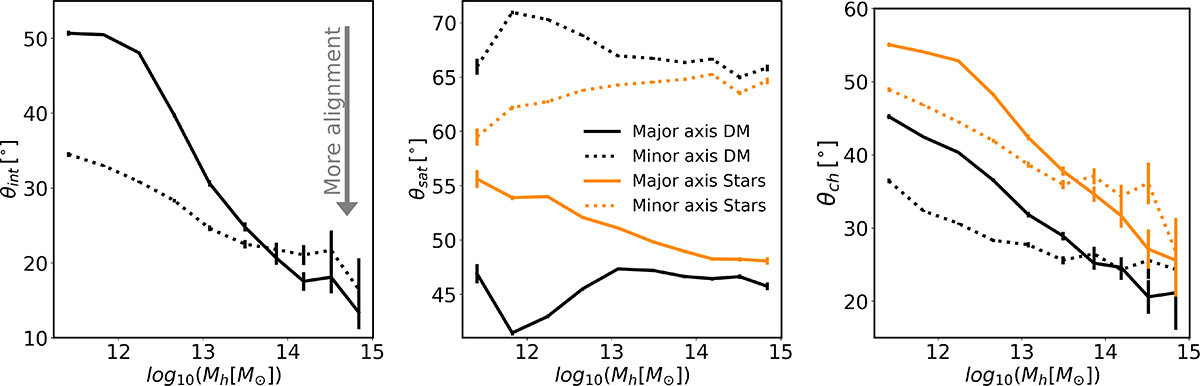
Relation between the alignment and the mass of the halo in which the central galaxies of the sample are located. The left, centre, and right panels present this relation for angles θint, θsat, and θch respectively. In all panels, solid lines represent the major axis, while dotted lines represent the minor axis. Additionally, where possible, measurements based solely on stellar information are indicated in yellow. Error bars were calculated using the standard deviation of the mean. The left panel illustrates the direction of increasing alignment. This feature is consistent across all panels displaying alignments in this figure and the subsequent ones.
Current usage metrics show cumulative count of Article Views (full-text article views including HTML views, PDF and ePub downloads, according to the available data) and Abstracts Views on Vision4Press platform.
Data correspond to usage on the plateform after 2015. The current usage metrics is available 48-96 hours after online publication and is updated daily on week days.
Initial download of the metrics may take a while.