Fig. 1.
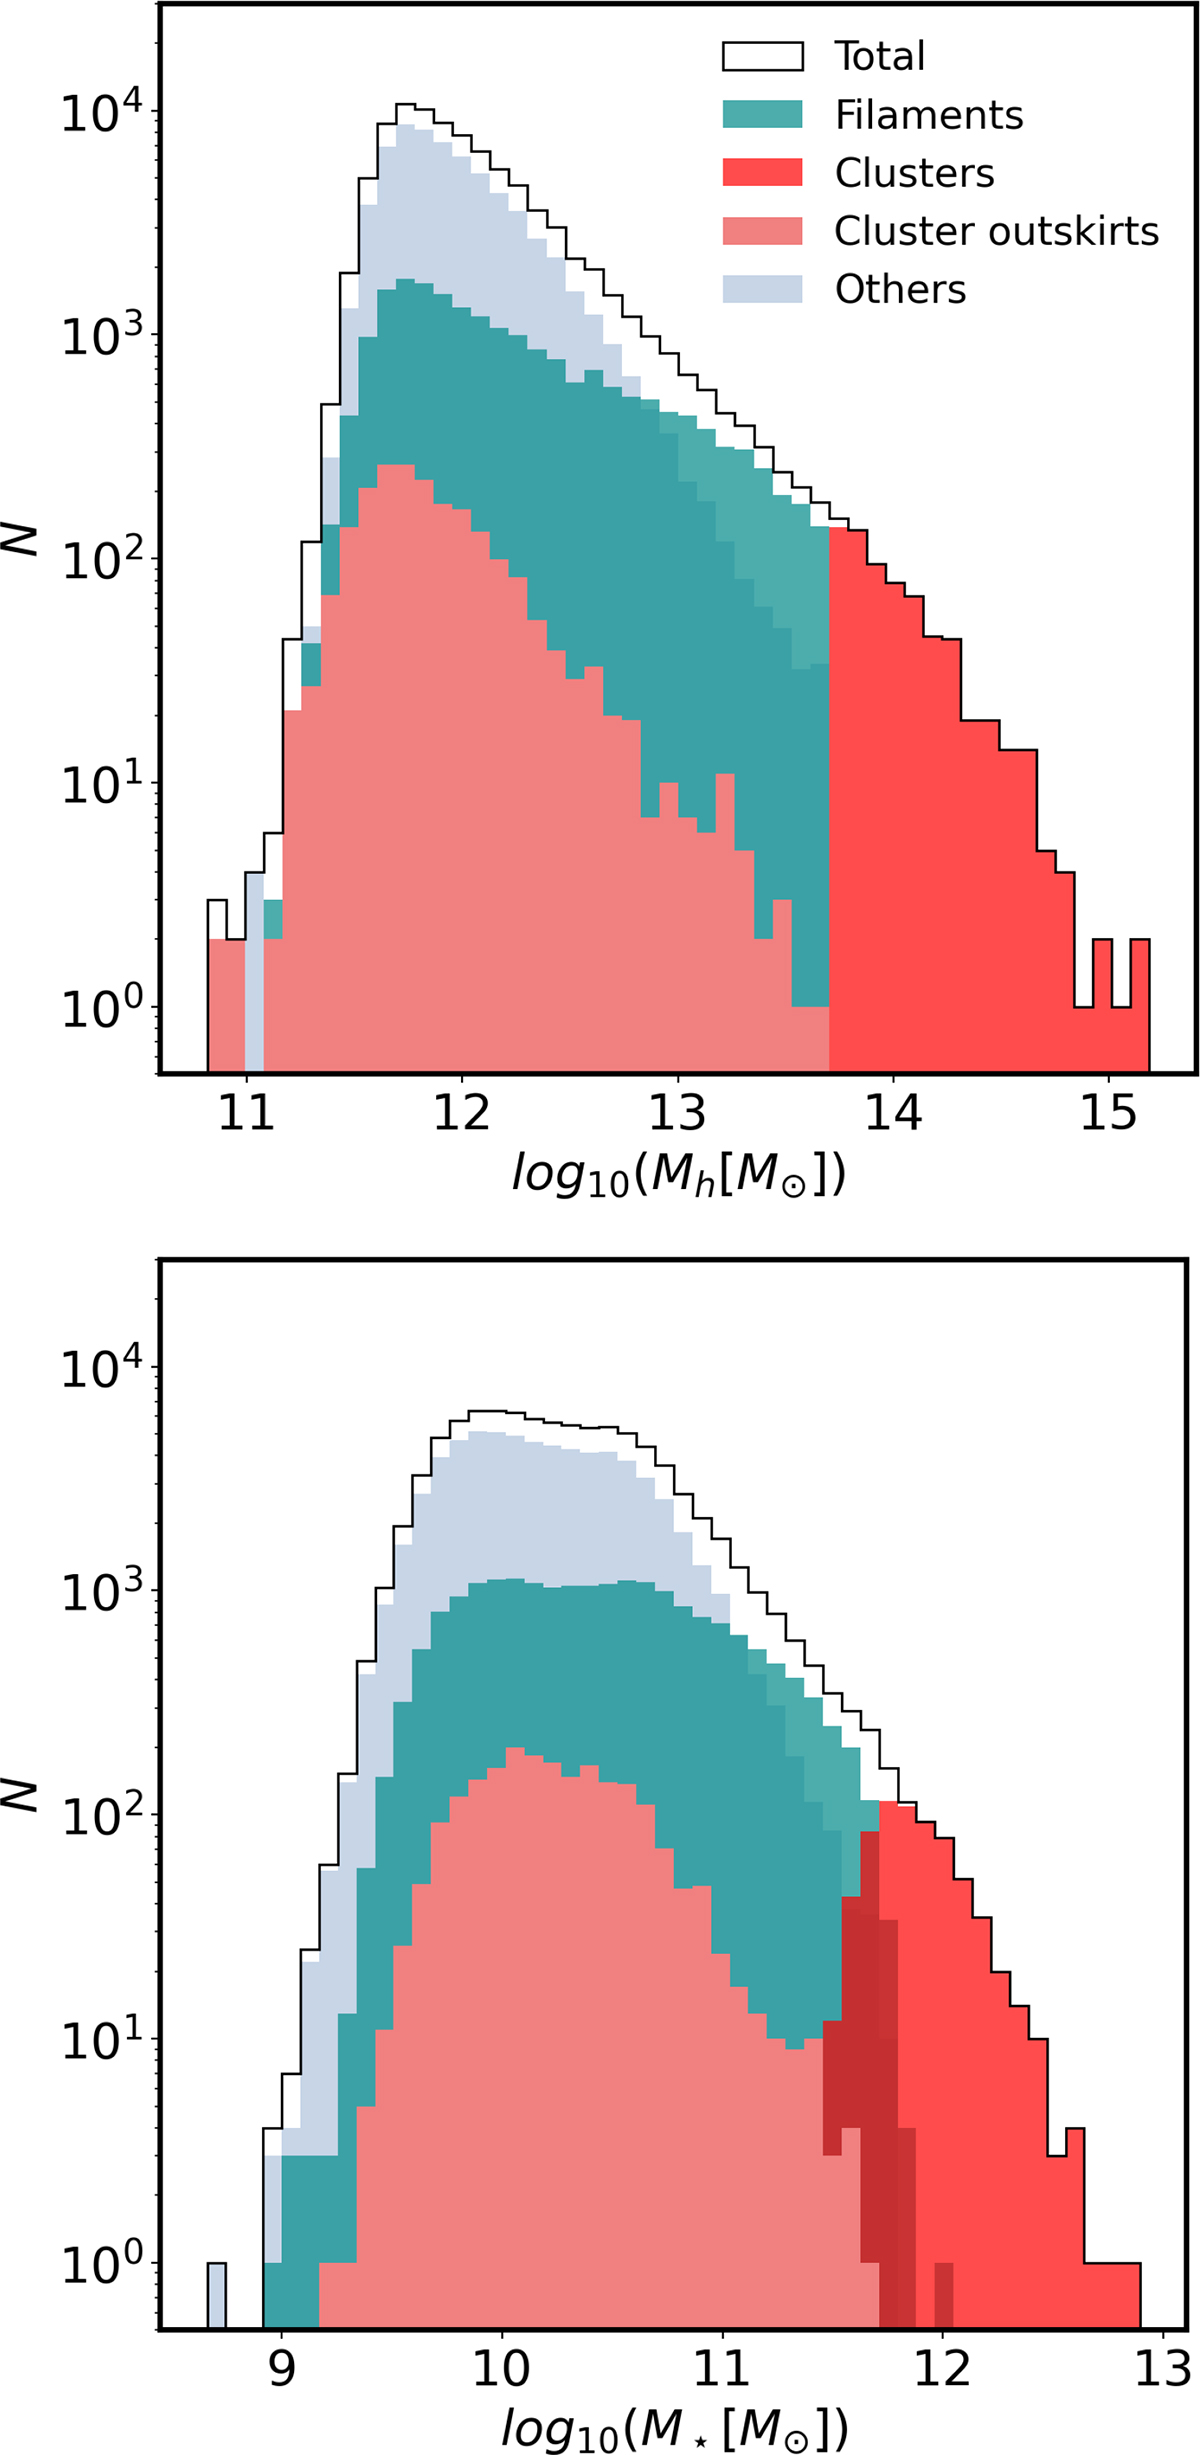
Download original image
Mass distributions of halos and their central galaxies in TNG300. Top panel: Distribution of total halo masses (Mh). Bottom panel: Stellar mass (M★) distribution of central galaxies. In both panels, the total sample is represented by a solid black line, while different environmental subsets are indicated as follows: filaments are shown in green, clusters in red, cluster outskirts in pink, and others in light blue.
Current usage metrics show cumulative count of Article Views (full-text article views including HTML views, PDF and ePub downloads, according to the available data) and Abstracts Views on Vision4Press platform.
Data correspond to usage on the plateform after 2015. The current usage metrics is available 48-96 hours after online publication and is updated daily on week days.
Initial download of the metrics may take a while.