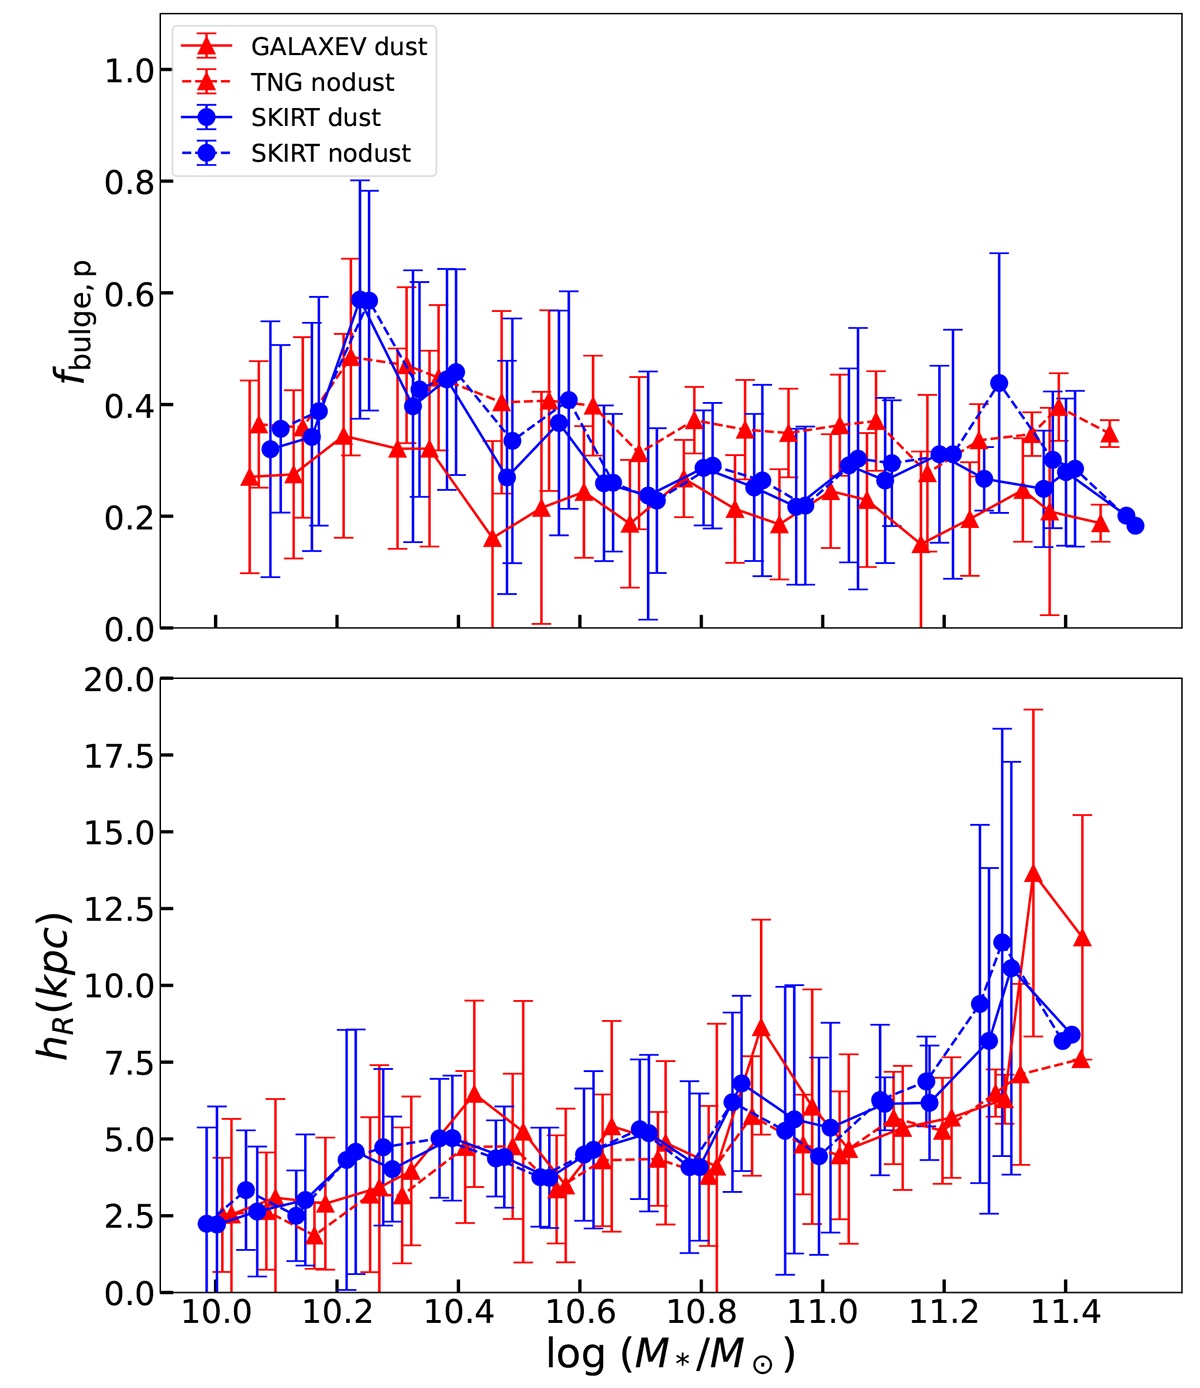
Fig. 6.
Download original image
GALFIT fitting results using mock images generated by GALAXEV and SKIRT, in both dust-free (dashed lines) and dusty (solid lines) conditions. The upper panel shows the variation in bulge fraction fbulge, p with stellar mass. The lower panel illustrates how the scale length of the disk hR. Dashed and solid lines represent the median values, whose error bars correspond to the 1σ range.
Current usage metrics show cumulative count of Article Views (full-text article views including HTML views, PDF and ePub downloads, according to the available data) and Abstracts Views on Vision4Press platform.
Data correspond to usage on the plateform after 2015. The current usage metrics is available 48-96 hours after online publication and is updated daily on week days.
Initial download of the metrics may take a while.