Fig. 13
Download original image
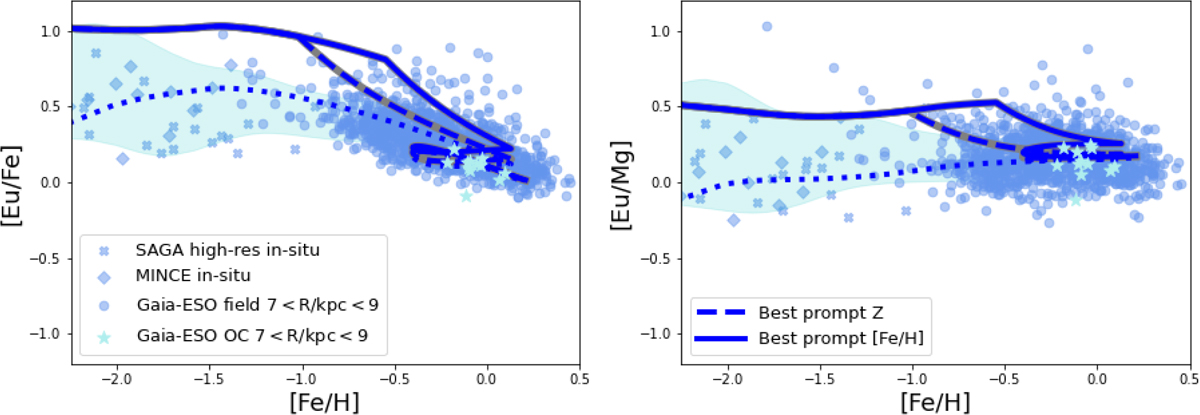
[Eu/Fe] vs [Fe/H] (left panel) and [Eu/Mg] vs [Fe/H] (right panel) for the MW models with increased prompt sources (MRD-SNe and/or collapsars) production at low metallicity. Solid lines represent evolutionary tracks for models with Eu enrichment setup as the best model for Local Group dwarfs, while dashed lines models for which the MW galaxy has a metallicity threshold Z corresponding to the [Fe/H]thresh as computed for Local Group dwarfs. For comparison, the model with standard Eu enrichment setup is also shown (dotted lines). Data legend is as in Figs. 5 and 12.
Current usage metrics show cumulative count of Article Views (full-text article views including HTML views, PDF and ePub downloads, according to the available data) and Abstracts Views on Vision4Press platform.
Data correspond to usage on the plateform after 2015. The current usage metrics is available 48-96 hours after online publication and is updated daily on week days.
Initial download of the metrics may take a while.