Fig. 8
Download original image
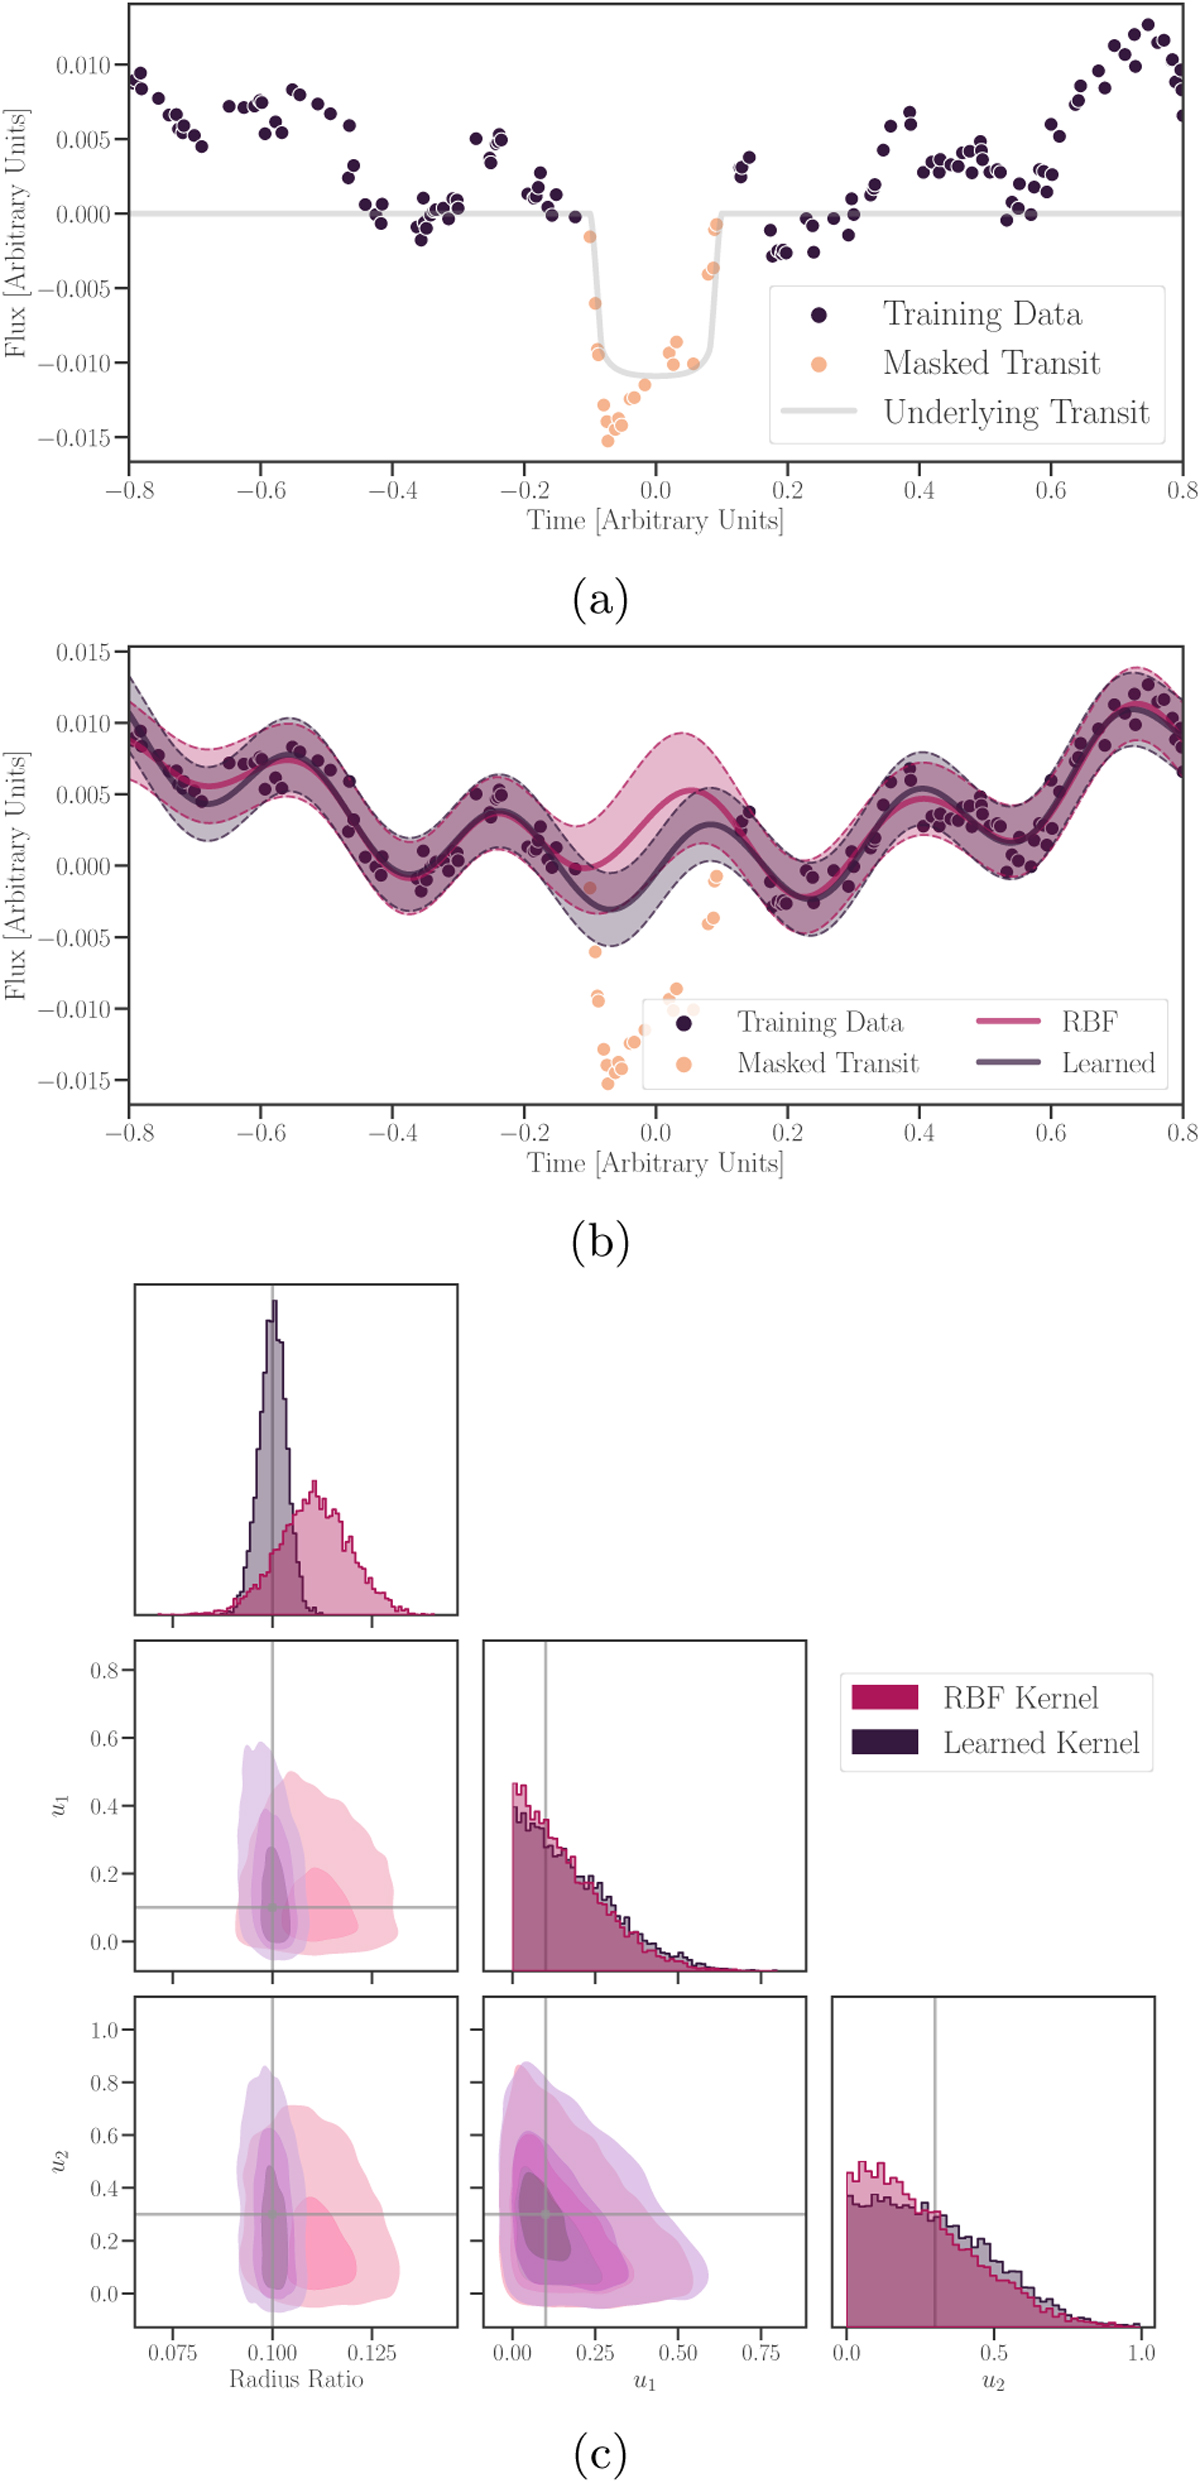
Transit parameter fit for the synthetic light curve with noticeable stellar variability and correlated noise in Sect. 4.2.2. (a) Synthetic data with correlated noise generated using an AR(1) process, with an added transit signal. The grey line corresponds to the underlying transit light curve. (b) GP prediction for the learned kernel structure (purple) and the RBF kernel (magenta). The central line corresponds to the mean prediction with a confidence band of one standard deviation. (c) Posterior distribution for the transit parameter, p, using the learned kernel and RBF kernel to construct the predictive distribution.
Current usage metrics show cumulative count of Article Views (full-text article views including HTML views, PDF and ePub downloads, according to the available data) and Abstracts Views on Vision4Press platform.
Data correspond to usage on the plateform after 2015. The current usage metrics is available 48-96 hours after online publication and is updated daily on week days.
Initial download of the metrics may take a while.