Fig. 7
Download original image
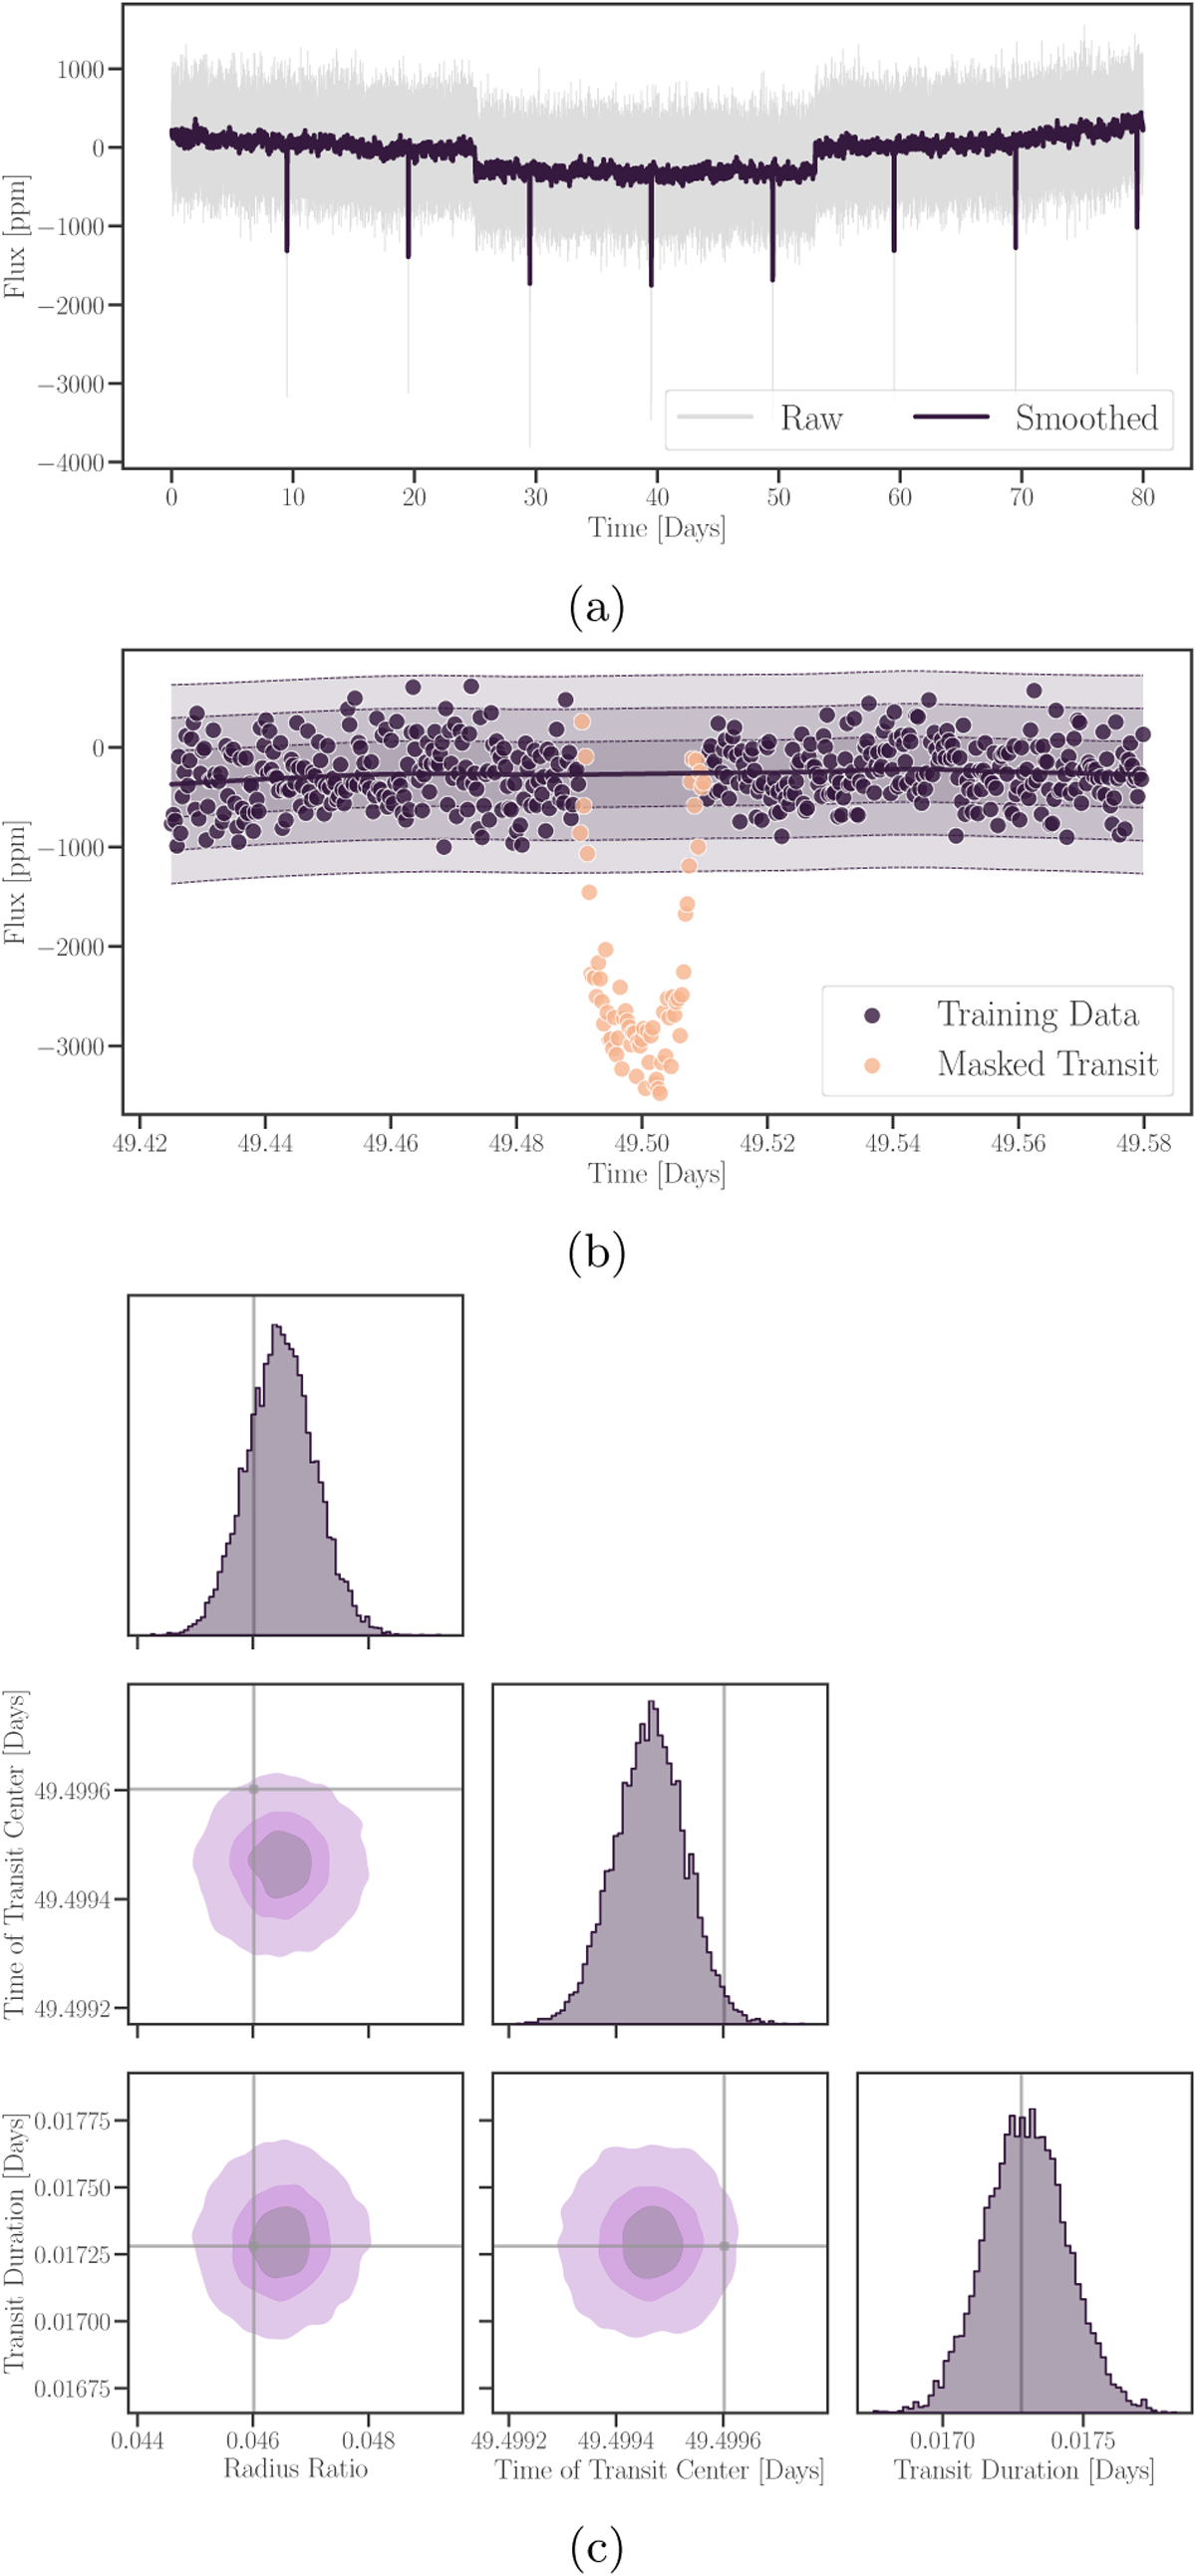
Example of a transit parameter fit for a PLATO-like light curve. (a) Simulated 80-day light curve for 16 Cyg B using the PLATO Solar-like Light-curve Simulator. The grey curve shows the original light curve, and the purple shows a running mean average. (b) Zoom in on a single transit event. The purple data points are used to train and condition the GP, while the yellow data correspond to the masked transit. Also shown is the mean GP prediction, and the one, two, and three standard deviation confidence bands. (c) Posterior distribution for the transit parameter, p, using the GP predictive distribution as likelihood. The grey lines represent the true values.
Current usage metrics show cumulative count of Article Views (full-text article views including HTML views, PDF and ePub downloads, according to the available data) and Abstracts Views on Vision4Press platform.
Data correspond to usage on the plateform after 2015. The current usage metrics is available 48-96 hours after online publication and is updated daily on week days.
Initial download of the metrics may take a while.