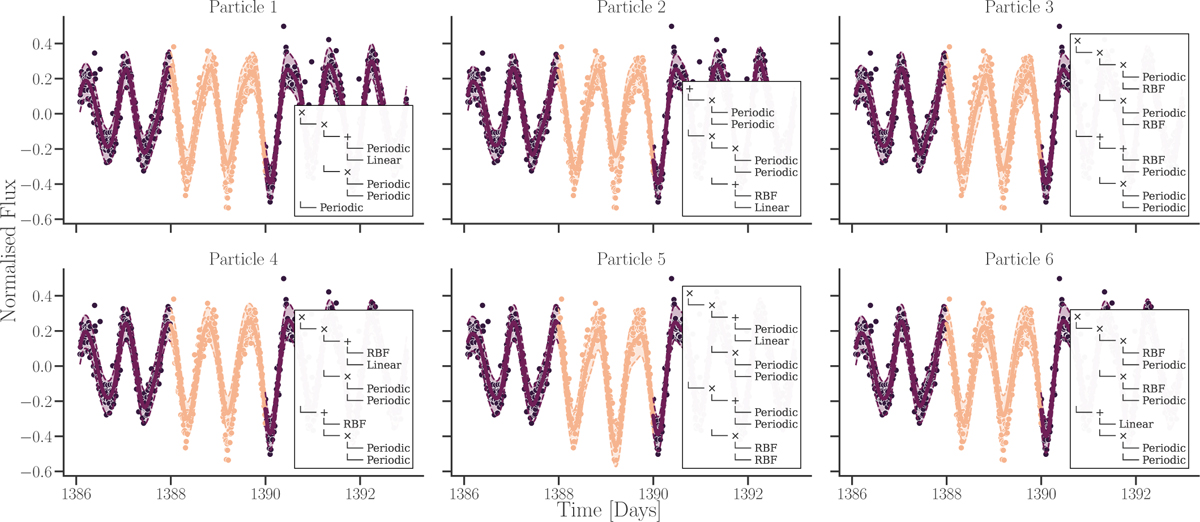
Fig. 5
Download original image
Sample of predictions for individual particles from the final SMC ensemble used for Fig. 3, including their respective kernel structures. Particles exhibit a variety of kernel structures and produce varying predictions, which leads to a more robust overall prediction when combined. Note that while the depth of every kernel displayed here corresponds to the maximum tree depth, Dmax = 3, the learned kernels can end up shallower if simpler kernel structures are preferred.
Current usage metrics show cumulative count of Article Views (full-text article views including HTML views, PDF and ePub downloads, according to the available data) and Abstracts Views on Vision4Press platform.
Data correspond to usage on the plateform after 2015. The current usage metrics is available 48-96 hours after online publication and is updated daily on week days.
Initial download of the metrics may take a while.