Fig. A.2.
Download original image
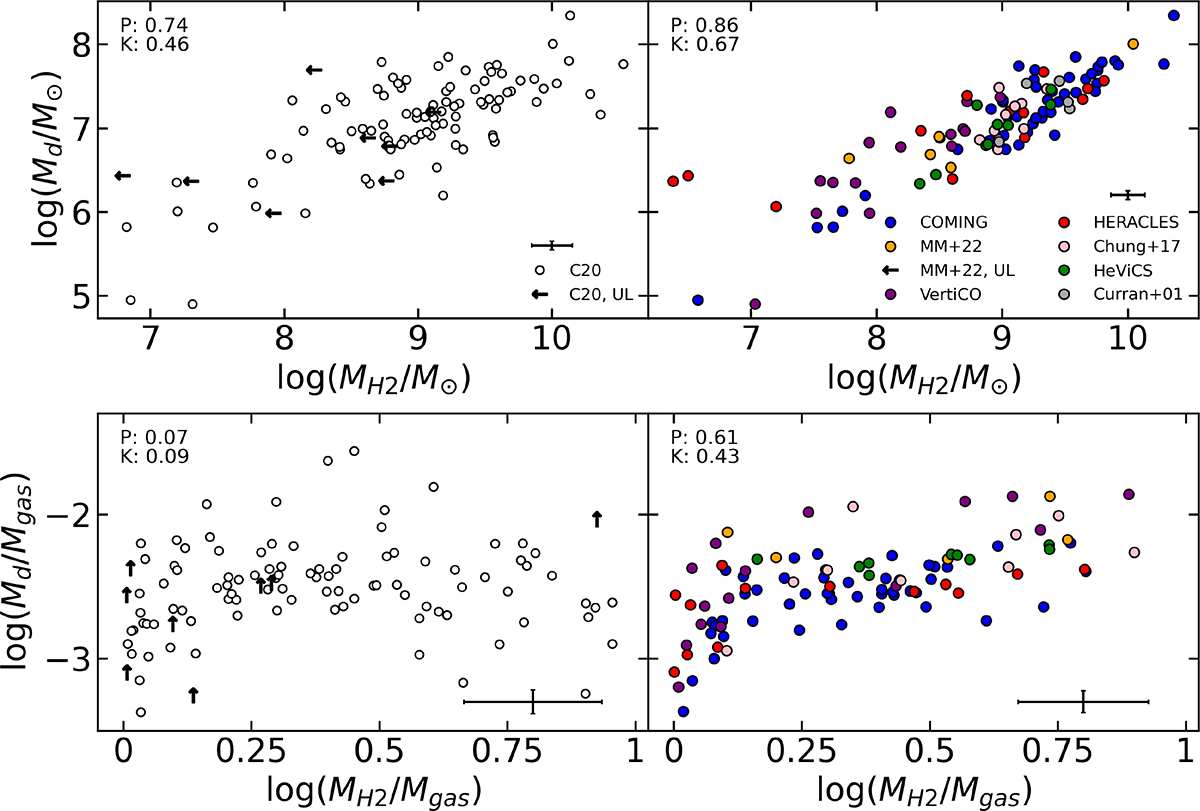
Effect of the adoption of MH2 from C20 or from this work. Top row: Dust vs molecular gas mass, adopting the MH2 estimate from C20 and presented here (left and right panel, respectively). The correlation coefficients (namely, P and K) are reported in the bottom left corner of both panels. In the right panel, objects are color-coded based on the survey from which the data were taken. MH2 upper limits are marked as shown in the legends. Bottom row: DTGR vs molecular fraction, with MH2 as in the top row. Upper limits and galaxies are shown as described in the corresponding upper panels.
Current usage metrics show cumulative count of Article Views (full-text article views including HTML views, PDF and ePub downloads, according to the available data) and Abstracts Views on Vision4Press platform.
Data correspond to usage on the plateform after 2015. The current usage metrics is available 48-96 hours after online publication and is updated daily on week days.
Initial download of the metrics may take a while.