Fig. 7.
Download original image
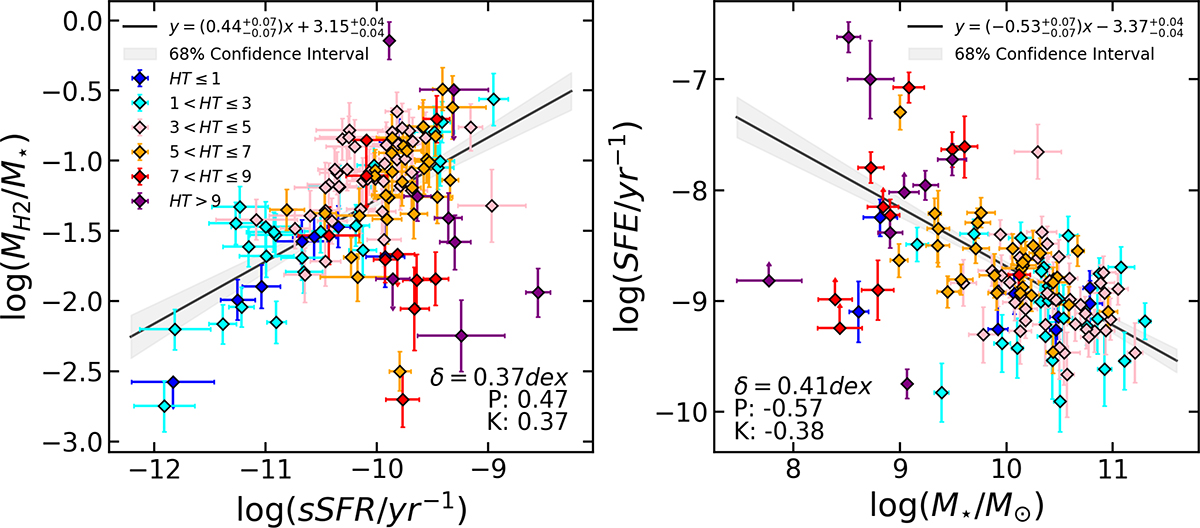
Left panel: Molecular-to-stellar mass ratio vs. sSFR. Data are color coded according to the morphological type, as in Fig. 3. The best-fit line is represented with a solid black line, and the gray-shaded region represents the 68% confidence interval of the posterior distribution of the parameters. The intrinsic dispersion (δintr) and correlation coefficients (namely, P and K) are reported in the lower (upper) right corner of the left (right) panel. Right panel: Star formation efficiency vs. stellar mass.
Current usage metrics show cumulative count of Article Views (full-text article views including HTML views, PDF and ePub downloads, according to the available data) and Abstracts Views on Vision4Press platform.
Data correspond to usage on the plateform after 2015. The current usage metrics is available 48-96 hours after online publication and is updated daily on week days.
Initial download of the metrics may take a while.