Fig. 4.
Download original image
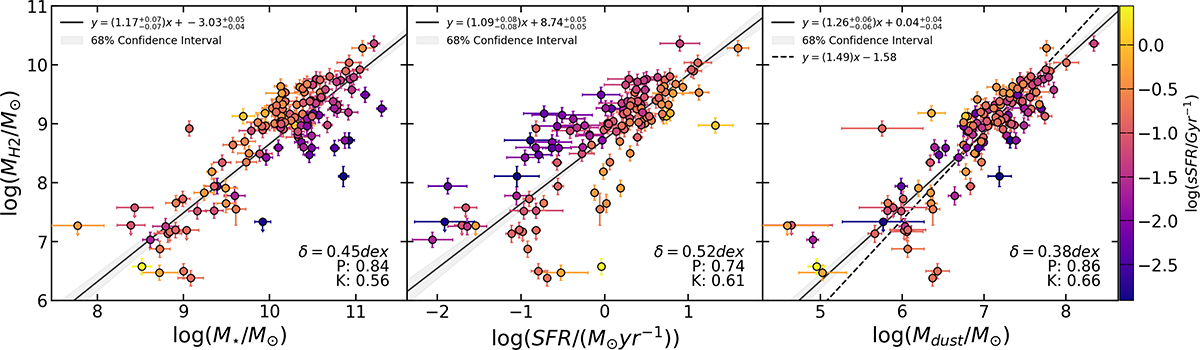
Molecular gas mass scaling relations. From left to right: MH2 vs. M⋆, SFR, and Mdust. Data are color coded for the sSFR. The best-fit parameters for each scaling relation are reported in the upper-left corner, while the best-fit line is represented with a solid black line. The intrinsic dispersion (δ) is reported in the lower-right corner, followed by the correlation coefficients (namely, P and K).
Current usage metrics show cumulative count of Article Views (full-text article views including HTML views, PDF and ePub downloads, according to the available data) and Abstracts Views on Vision4Press platform.
Data correspond to usage on the plateform after 2015. The current usage metrics is available 48-96 hours after online publication and is updated daily on week days.
Initial download of the metrics may take a while.