Fig. 3.
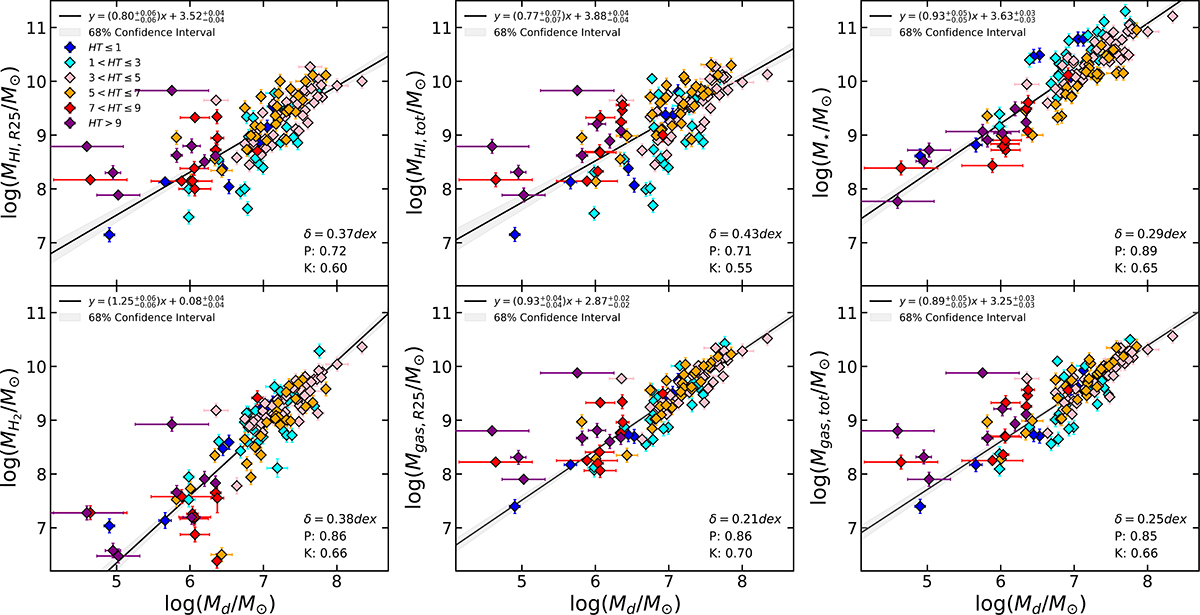
Download original image
Gas and stellar masses vs. dust mass. In the upper row, the atomic gas mass within R25 (left panel), the total atomic gas mass (central panel), and the stellar mass (right panel) are plotted against the dust mass. In the bottom row, the molecular gas mass (left panel), the total gas mass (atomic plus molecular) measured within the optical radius (central panel), and the total gas mass measured over the entire galactic disk (right panel) are plotted against the dust mass. Data are color coded according to the morphological type (HT). The best-fit parameters for each scaling relation are reported in the upper left corner, while the best-fit line is represented with the solid black line. The 68% confidence interval of the best-fit parameters is represented as a gray-shaded region. The intrinsic dispersion (δ) is reported in the bottom right corner, followed by the correlation coefficients (namely, P and K).
Current usage metrics show cumulative count of Article Views (full-text article views including HTML views, PDF and ePub downloads, according to the available data) and Abstracts Views on Vision4Press platform.
Data correspond to usage on the plateform after 2015. The current usage metrics is available 48-96 hours after online publication and is updated daily on week days.
Initial download of the metrics may take a while.