Fig. E.1.
Download original image
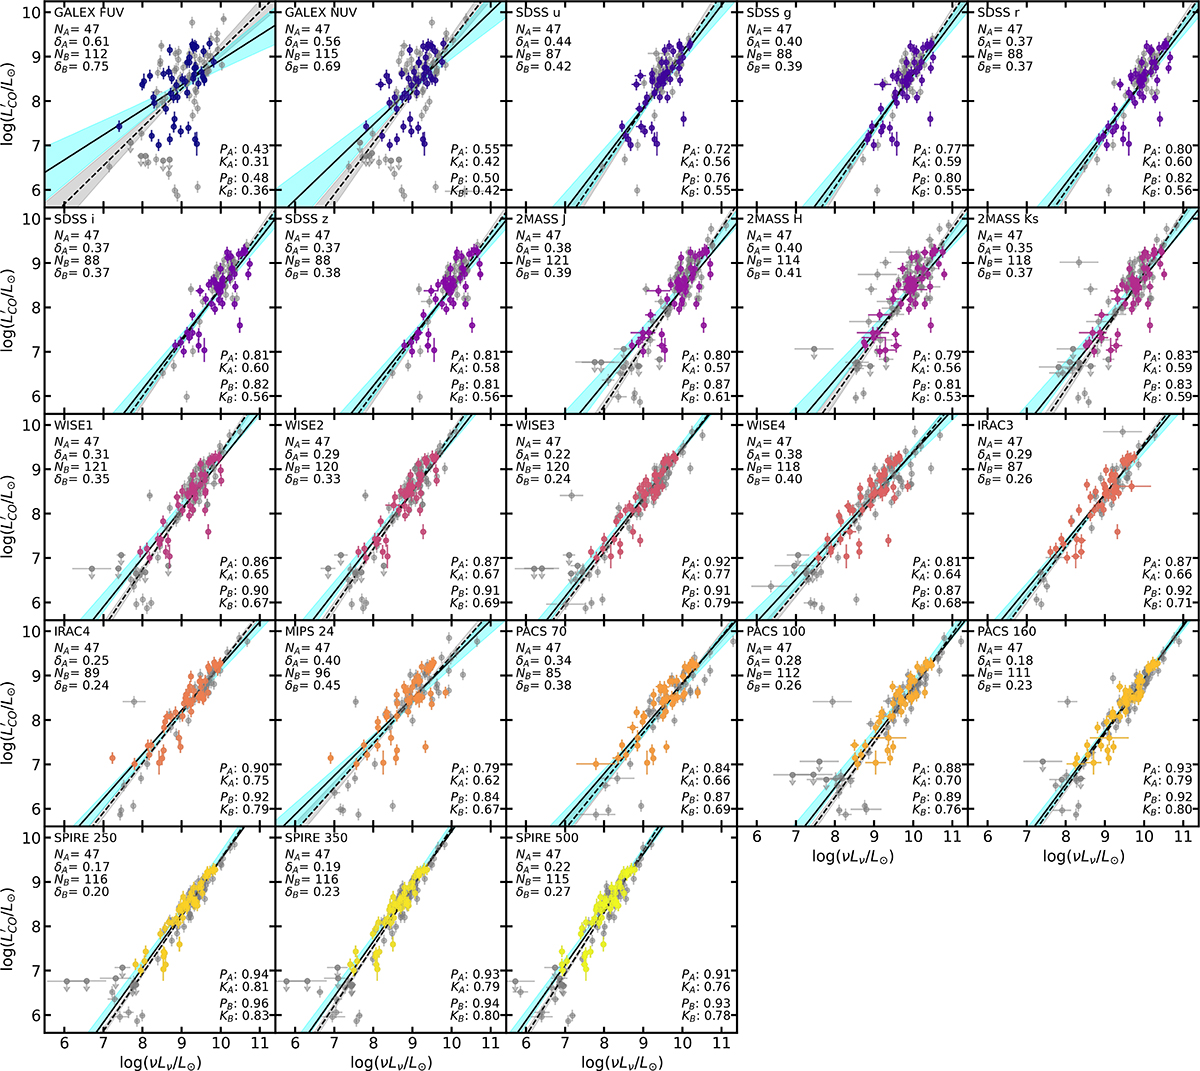
![]() versus monochromatic luminosities. The names of telescopes and instruments used to derive the luminosities on the x-axis are reported in the upper-left corner of each panel. The galaxies from sample A (see text) are colored in each panel, while the remaining sources from sample B are in gray in each panel. The best-fit relation on data from sample A (B) is the solid (dashed) black line, and the 68% confidence levels are shown as a cyan (light gray) region. Below, the number of galaxies used in the fitting procedure and the measured intrinsic dispersion for samples A and B, respectively. Correlation coefficients (namely, P and K) for samples A and B are shown in the lower-right corner of each panel.
versus monochromatic luminosities. The names of telescopes and instruments used to derive the luminosities on the x-axis are reported in the upper-left corner of each panel. The galaxies from sample A (see text) are colored in each panel, while the remaining sources from sample B are in gray in each panel. The best-fit relation on data from sample A (B) is the solid (dashed) black line, and the 68% confidence levels are shown as a cyan (light gray) region. Below, the number of galaxies used in the fitting procedure and the measured intrinsic dispersion for samples A and B, respectively. Correlation coefficients (namely, P and K) for samples A and B are shown in the lower-right corner of each panel.
Current usage metrics show cumulative count of Article Views (full-text article views including HTML views, PDF and ePub downloads, according to the available data) and Abstracts Views on Vision4Press platform.
Data correspond to usage on the plateform after 2015. The current usage metrics is available 48-96 hours after online publication and is updated daily on week days.
Initial download of the metrics may take a while.