Fig. B.1.
Download original image
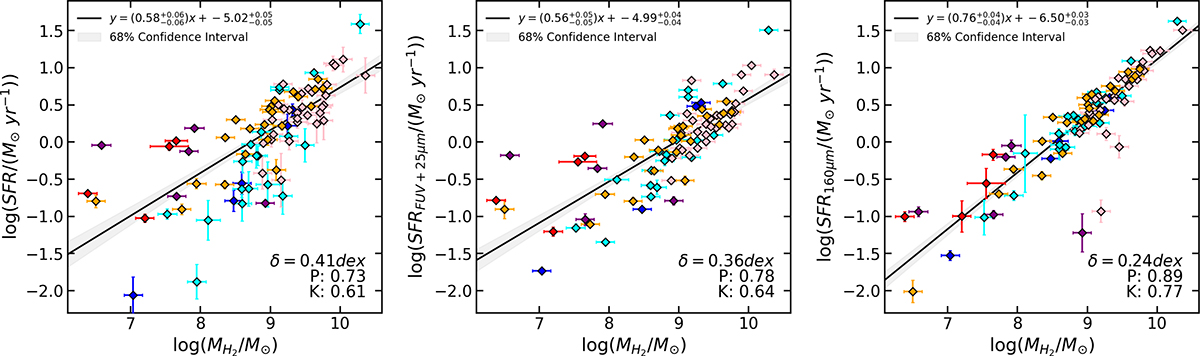
SFR vs molecular gas mass. Different SFR estimates vs MH2: SFR derived from the SED fitting with CIGALE (Nersesian et al. 2019; left panel), and from the hybrid FUV+24μm recipe (Leroy et al. 2019; right panel]). The 85 galaxies are color-coded by their morphological type. The best-fit parameters for each scaling relation are reported in the upper-left corner, while the best-fit line is represented with the black solid line. The intrinsic dispersion (δintr) is reported in the bottom-right corner, followed by the correlation coefficients (namely, P and K).
Current usage metrics show cumulative count of Article Views (full-text article views including HTML views, PDF and ePub downloads, according to the available data) and Abstracts Views on Vision4Press platform.
Data correspond to usage on the plateform after 2015. The current usage metrics is available 48-96 hours after online publication and is updated daily on week days.
Initial download of the metrics may take a while.