Fig. 1.
Download original image
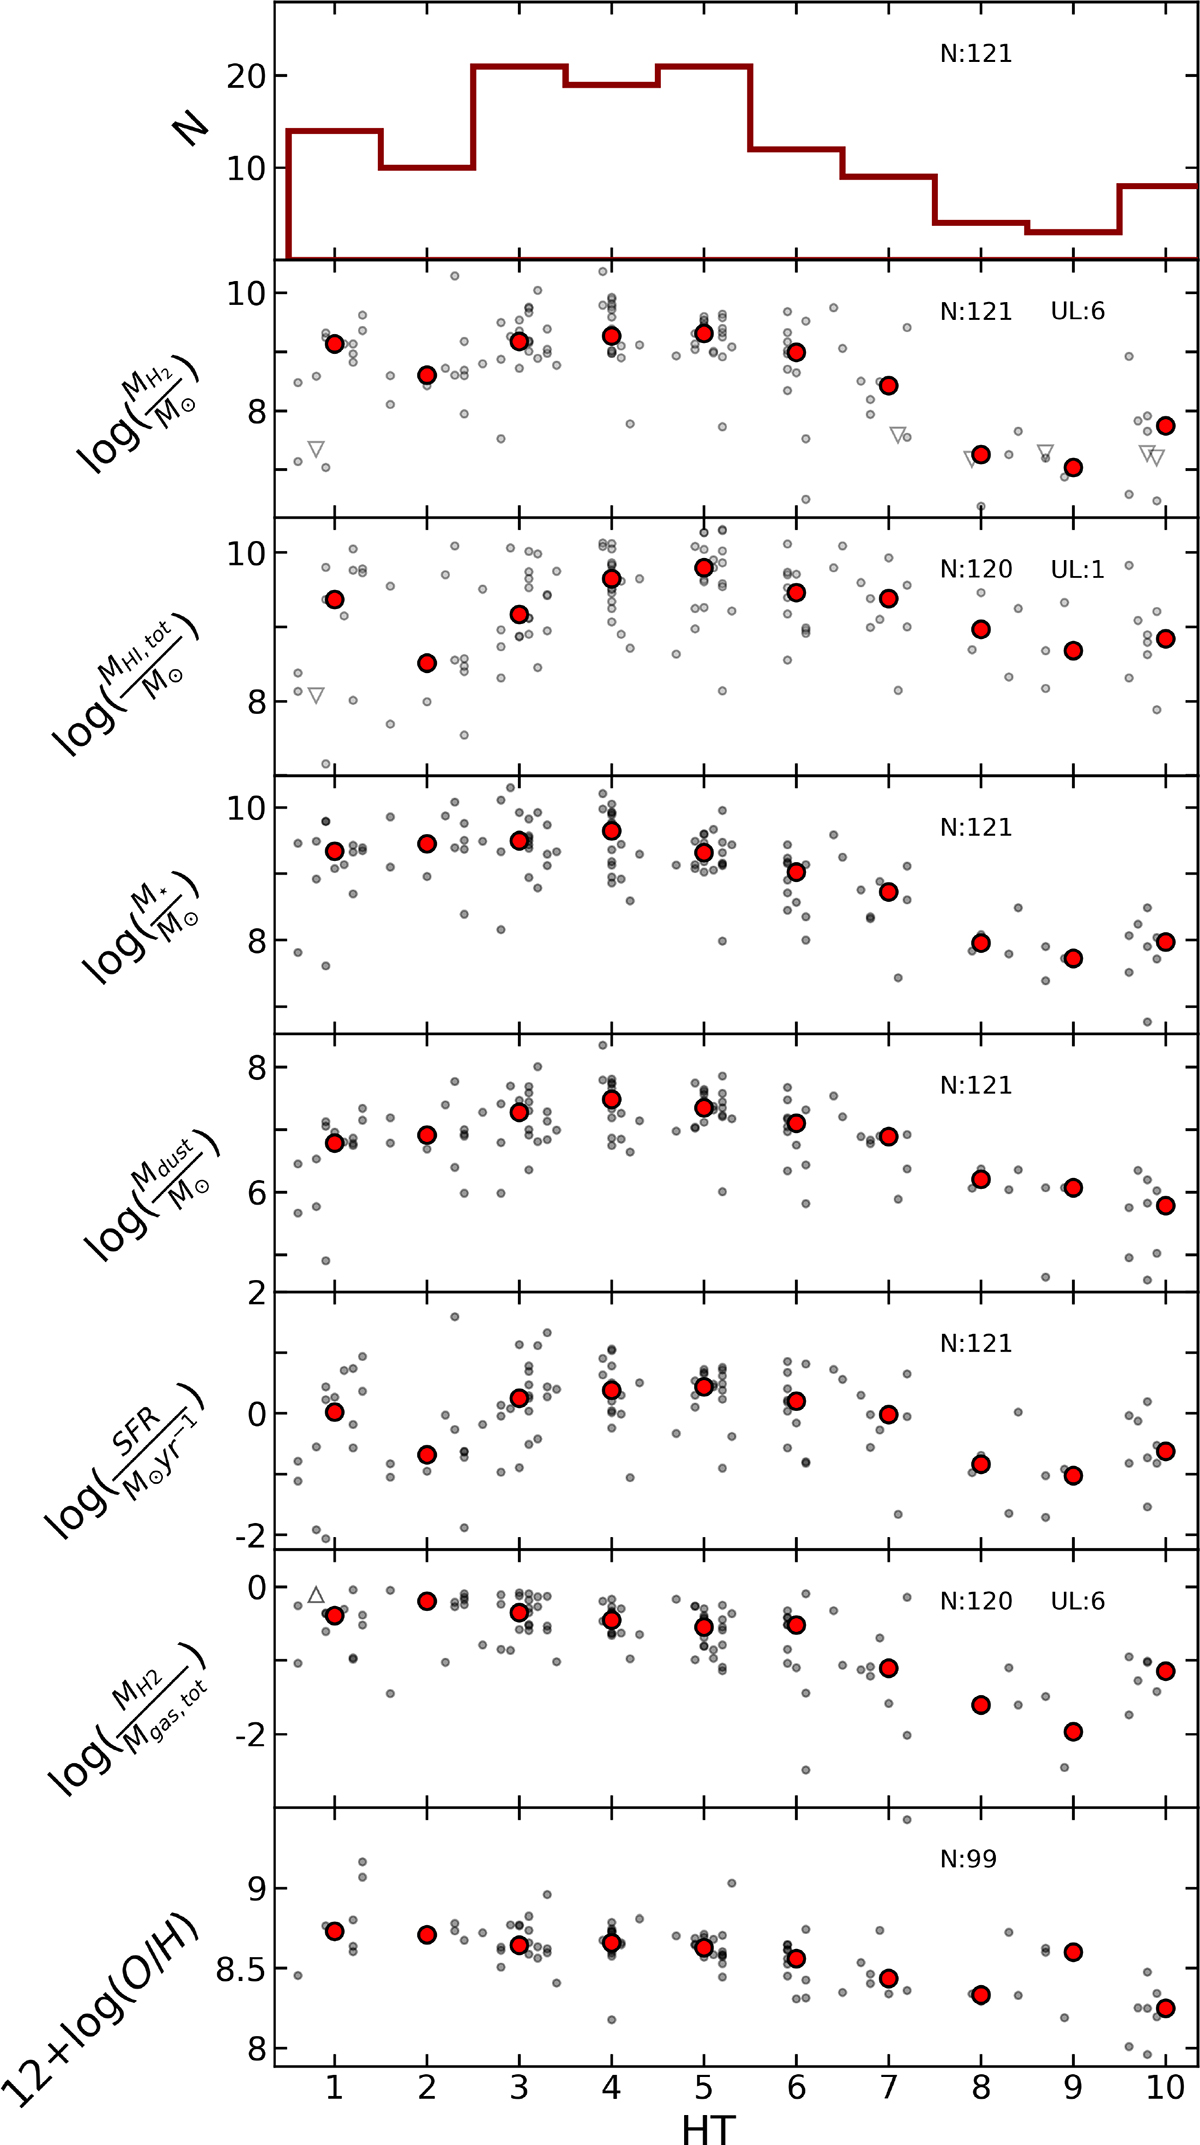
Overview of the properties of our sample as a function of the Hubble stage parameter (HT). From top to bottom: histogram of the number of galaxies in each bin (ΔT = 1); the distribution of the masses of different components, molecular (MH2) and atomic (MHI) gas, the dust (Mdust) and stars (M⋆), respectively; SFR, molecular-to-total gas fraction, and metallicity. Data are represented as gray points, the mean value in each bin of HT is a red circle. In each panel, we indicate the number of galaxies with measurements (and upper limits) for each quantity. This figure is similar to Fig. 1 by C20.
Current usage metrics show cumulative count of Article Views (full-text article views including HTML views, PDF and ePub downloads, according to the available data) and Abstracts Views on Vision4Press platform.
Data correspond to usage on the plateform after 2015. The current usage metrics is available 48-96 hours after online publication and is updated daily on week days.
Initial download of the metrics may take a while.