Fig. 8
Download original image
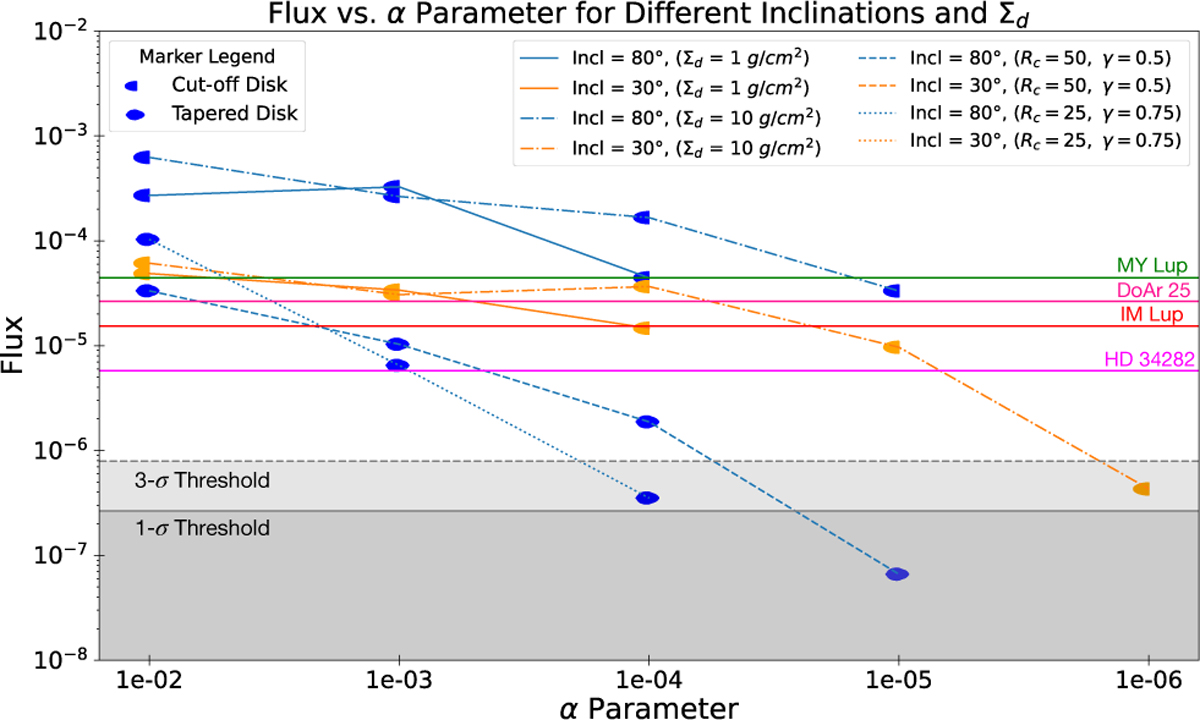
Line plot of integrated flux vs α parameter for cut-off and tapered disks at inclinations of 80° and 30°, with flux values in jansky. The flux values are presented for cut-off disks with Σd = 1 g/cm2 (solid lines) and Σd = 10 g/cm2 (dash-dot lines), as well as tapered disks with Rc = 50, γ = 0.5 (dashed lines) and Rc = 25, γ = 0.75 (dotted lines). The blue lines represent 80°, and the orange lines represent 30°. Horizontal grey lines mark the 1-sigma (solid) and 3-sigma (dashed) noise thresholds, indicating observation sensitivity. Reference flux levels from various sources are labelled above their respective horizontal lines for clarity.
Current usage metrics show cumulative count of Article Views (full-text article views including HTML views, PDF and ePub downloads, according to the available data) and Abstracts Views on Vision4Press platform.
Data correspond to usage on the plateform after 2015. The current usage metrics is available 48-96 hours after online publication and is updated daily on week days.
Initial download of the metrics may take a while.