Fig. 7
Download original image
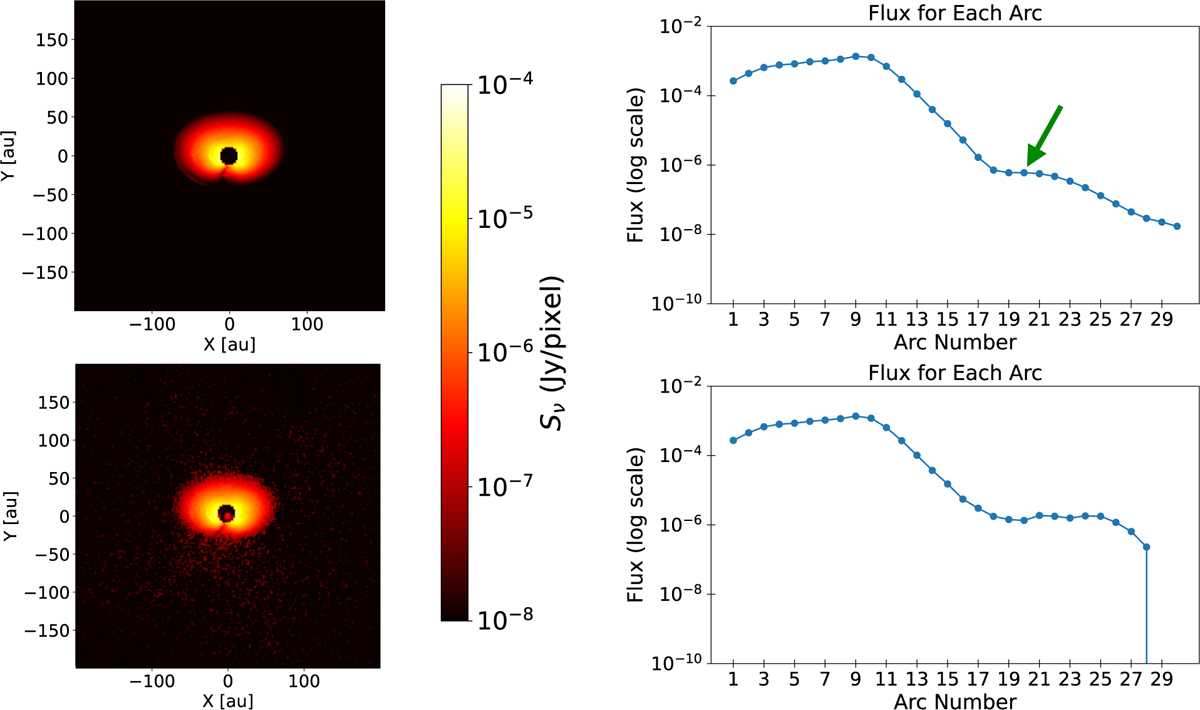
Impact of noise addition on a simulated disk image. The top row presents an image of a tapered disk with Rc = 25 au and a power-law exponent γ = 0.75 at an inclination of 45°. Correspondingly, the right panel illustrates the integrated flux as the ‘crescent’ (refer to Figure 3) traverses vertically through the disk image on the left, plotted on a logarithmic scale for integrated flux on the y-axis. The green arrow highlights the position of a minor secondary peak representing the backside flux. In the bottom row, the left panel displays the same simulated disk image with added Uϕ noise, while the right panel shows the integrated flux as the ‘crescent’ moves down through the noise-added image, also plotted on a logarithmic scale for integrated flux on the y-axis.
Current usage metrics show cumulative count of Article Views (full-text article views including HTML views, PDF and ePub downloads, according to the available data) and Abstracts Views on Vision4Press platform.
Data correspond to usage on the plateform after 2015. The current usage metrics is available 48-96 hours after online publication and is updated daily on week days.
Initial download of the metrics may take a while.