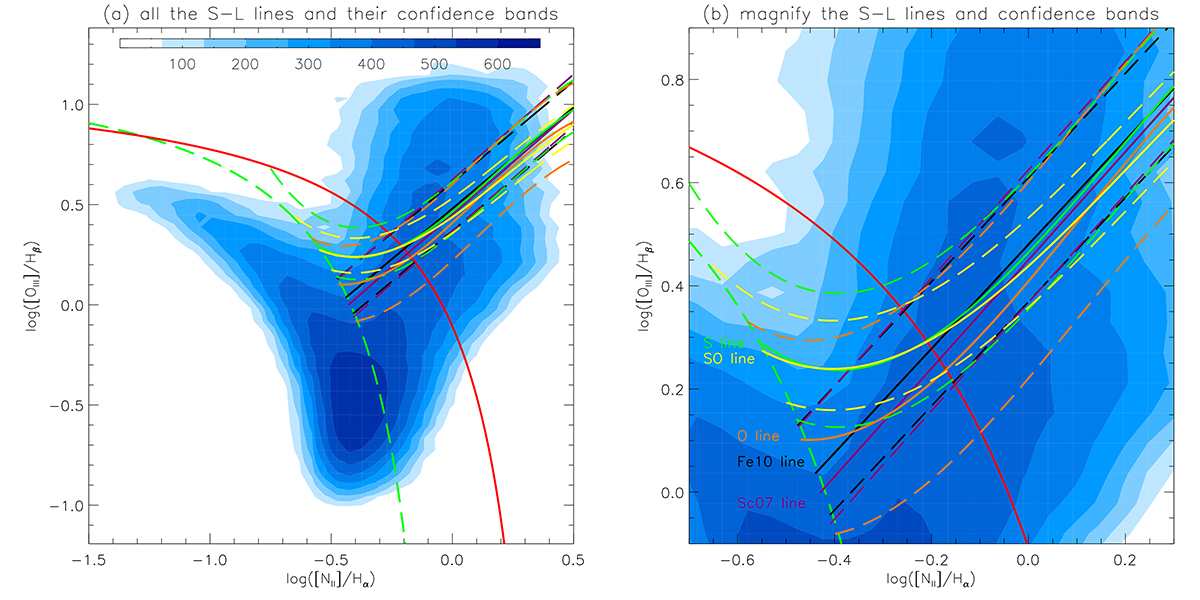
Fig. 8.
Download original image
Comparison of all the versions of the S-L lines and their confidence bands mentioned in this paper, in the [N II] BPT diagram. (a) shows the S line (solid green line), the O line (solid orange line), the SO line (solid yellow line), the Sc07 line (solid purple line), and the Fe10 line (solid black line), and the corresponding confidence bands in dashed lines in the same color. The Ke01 line and the Ka03 line have the same line styles as in Fig. 3. The contour filled with bluish colors represents the results for the sample of our collected galaxies. The corresponding number densities of the different colors are shown in the colorbar on the top of the panel. (b) shows the S-L lines in the [N II] BPT diagram within smaller limited ranges of log([N II]/Hα) and log([O III]/Hβ).
Current usage metrics show cumulative count of Article Views (full-text article views including HTML views, PDF and ePub downloads, according to the available data) and Abstracts Views on Vision4Press platform.
Data correspond to usage on the plateform after 2015. The current usage metrics is available 48-96 hours after online publication and is updated daily on week days.
Initial download of the metrics may take a while.