Fig. 7.
Download original image
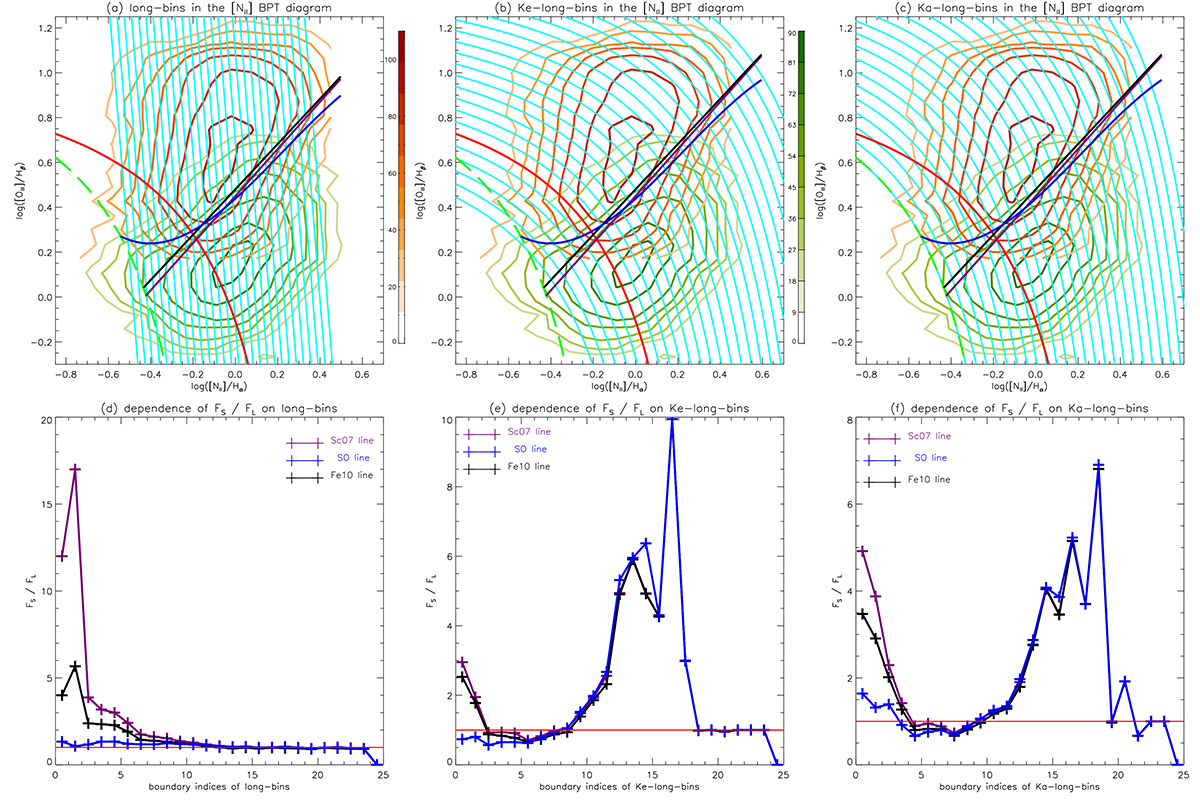
Process and results for testing the dependencies of FS/FL on long-bins, Ke-long-bins, and Ka-long-bins. (a) shows long-bins in the [N II] BPT diagram. The contours with levels shown with colors from the color table of RED TEMPERATURE and from the color table of green-to-white LINEAR represent the results for the Seyferts and LINERs classified in the [S II] and [O I] BPT diagram, respectively. The corresponding number densities of the contour levels are shown in the colorbars on both sides of panel (b). The 28 lines in cyan represent the boundaries of long-bins. The solid red line is the Ke01 line. The dashed green line is the Ka03 line. The solid purple line is the Sc07 line. The solid black line is the Fe10 line. The solid blue line is the SO line. (b) shows Ke-long-bins in the [N II] BPT diagram. The symbols and line styles have the same meanings as those in panel (a), but the 25 arcs in cyan represent the boundaries of Ke-long-bins. (c) shows Ka-long-bins in the [N II] BPT diagram. The symbols and line styles have the same meanings as those in panel (a), but the 25 arcs in cyan represent the boundaries of Ka-long-bins. (d) shows the dependence of FS/FL for S-L lines on long-bins. The colors of the polylines correspond to the colors of the S-L lines in panel (a), purple for the Sc07 line, black for the Fe10 line, and blue for the SO line. The red horizontal line indicates log([N II]/Hα) = 1. (e) shows the dependence of FS/FL for S-L lines on Ke-long-bins. The other symbols and line styles have the same meanings as those in panel (d). (f) shows the dependence of FS/FL for S-L lines on Ka-long-bins. The other symbols and line styles have the same meanings as those in panel (d).
Current usage metrics show cumulative count of Article Views (full-text article views including HTML views, PDF and ePub downloads, according to the available data) and Abstracts Views on Vision4Press platform.
Data correspond to usage on the plateform after 2015. The current usage metrics is available 48-96 hours after online publication and is updated daily on week days.
Initial download of the metrics may take a while.