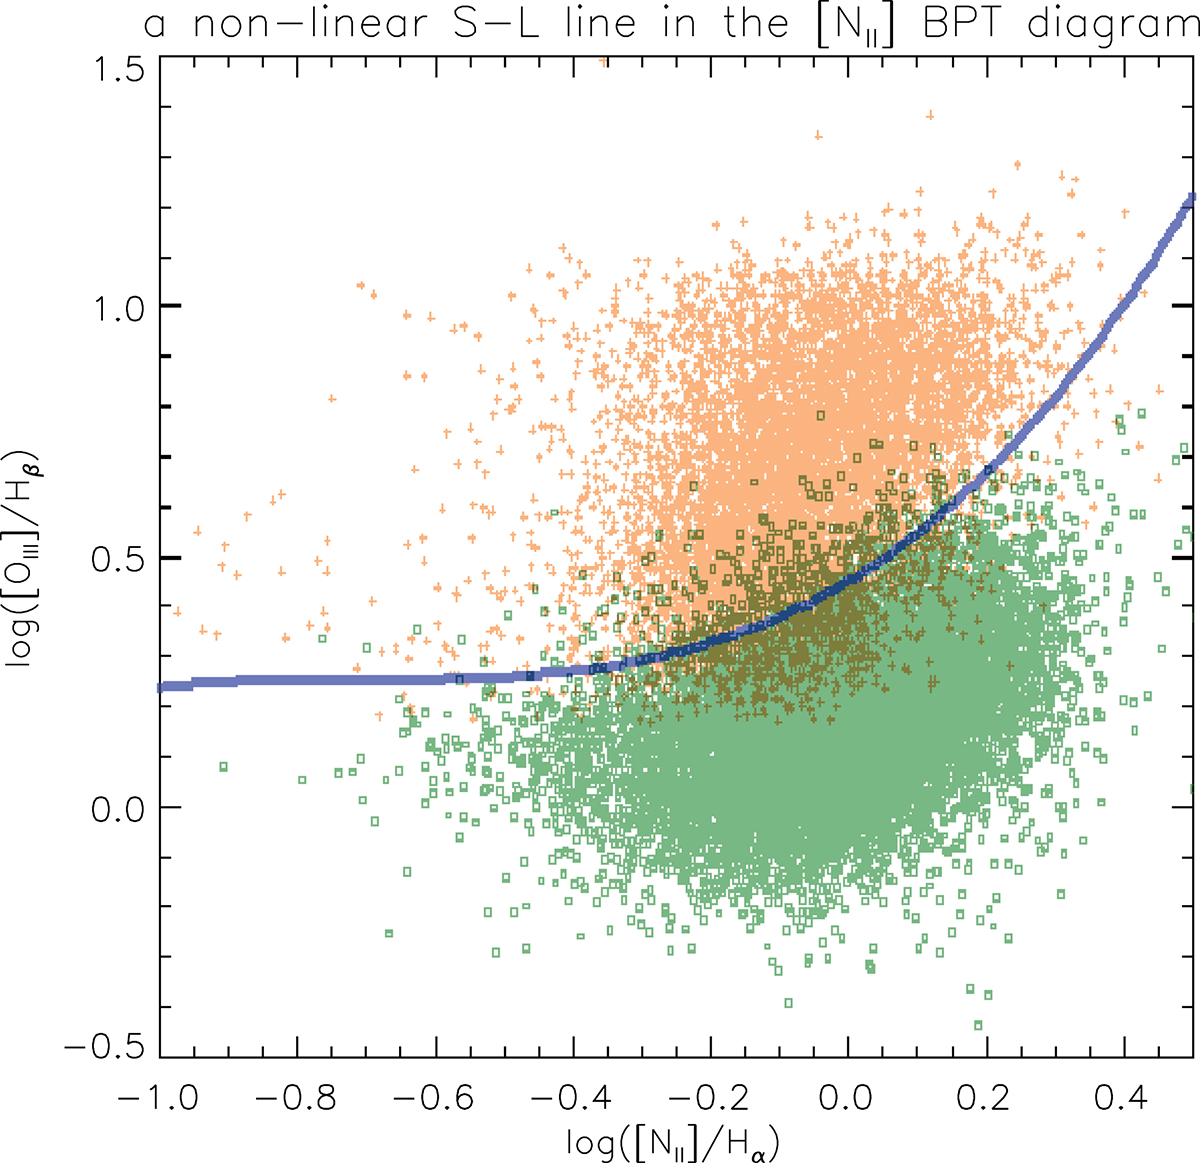
Fig. 2.
Download original image
Semitransparent visualization of the intersection boundary between Seyferts and LINERs in the [N II] BPT diagram. The nonlinear line in blue represents a simple outline of the intersection boundary determined by visual inspection. The plus signs in orange and hollow squares in dark green represent the Seyferts and LINERs that have been classified in both the [S II] and [O I] BPT diagrams, respectively.
Current usage metrics show cumulative count of Article Views (full-text article views including HTML views, PDF and ePub downloads, according to the available data) and Abstracts Views on Vision4Press platform.
Data correspond to usage on the plateform after 2015. The current usage metrics is available 48-96 hours after online publication and is updated daily on week days.
Initial download of the metrics may take a while.