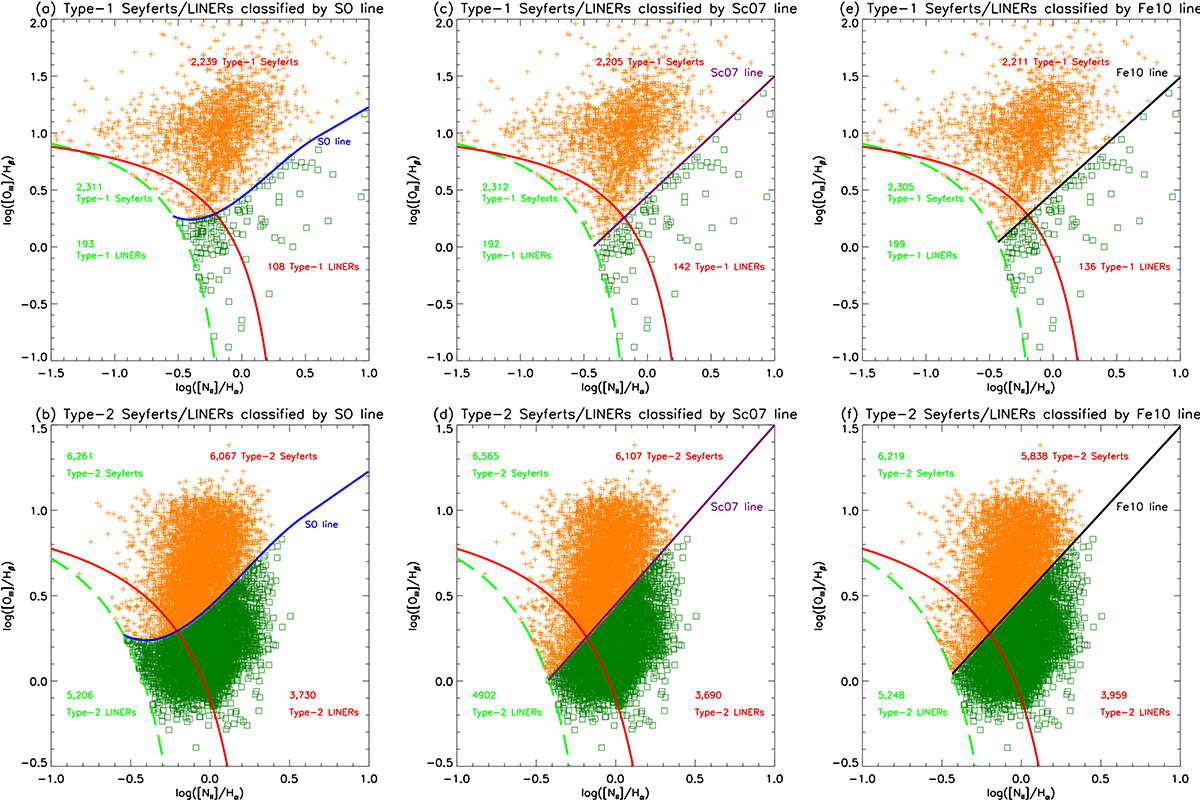
Fig. 11.
Download original image
Distributions and number counts of Type-1 Seyferts and Type-1 LINERs, as well as Type-2 Seyferts and Type-2 LINERs, classified by the SO line, Sc07 line, and the Fe10 line, respectively, combined with the Ke01 (Ka03) line, in the [N II] BPT diagram. (a) shows the distributions of Type-1 Seyferts and Type-1 LINERs classified by the SO line, combined with the Ke01 (Ka03) line, in the [N II] BPT diagram. The samples of Type-1 Seyferts (plus signs in orange) and Type-1 LINERs (hollow squares in dark green) are collected from the quasars catalog proposed by Shen et al. (2011). The solid red line is the Ke01 line. The dashed green line is the Ka03 line. The solid blue line is the SO line. The text highlighted in red (green) represents the number counts of Type-1 Seyferts and Type-1 LINERs classified by the SO line combined with the Ke01 (Ka03) line. (b) shows the distributions of Type-2 Seyferts and Type-2 LINERs classified by the SO line, combined with the Ke01 (Ka03) line, in the [N II] BPT diagram, while also considering the classification results of the Ke01 lines in the [S II] and [O I] BPT diagrams. The samples of Type-2 Seyferts (plus signs in orange) and Type-2 LINERs (hollow squares in dark green) are collected in Section 2. The other symbols and line styles have the same meanings as those in panel (a). (c) shows the distributions of Type-1 Seyferts and Type-1 LINERs classified by the Sc07 line, combined with the Ke01 (Ka03) line, in the [N II] BPT diagram. The solid purple line is the Sc07 line. The other symbols and line styles have the same meanings as those in panel (a). (d) shows the distributions of Type-2 Seyferts and Type-2 LINERs classified by the Sc07 line, combined with the Ke01 (Ka03) line, in the [N II] BPT diagram, while also considering the classification results of the Ke01 lines in the [S II] and [O I] BPT diagrams. The solid purple line is the Sc07 line. The other symbols and line styles have the same meanings as those in panel (b). (e) shows the distributions of Type-1 Seyferts and Type-1 LINERs classified by the Fe10 line, combined with the Ke01 (Ka03) line, in the [N II] BPT diagram. The solid black line is the Fe10 line. The other symbols and line styles have the same meanings as those in panel (a). (f) shows the distributions of Type-2 Seyferts and Type-2 LINERs classified by the Fe10 line, combined with the Ke01 (Ka03) line, in the [N II] BPT diagram, while also considering the classification results of the Ke01 lines in the [S II] and [O I] BPT diagrams. The solid black line is the Fe10 line. The other symbols and line styles have the same meanings as those in panel (b).
Current usage metrics show cumulative count of Article Views (full-text article views including HTML views, PDF and ePub downloads, according to the available data) and Abstracts Views on Vision4Press platform.
Data correspond to usage on the plateform after 2015. The current usage metrics is available 48-96 hours after online publication and is updated daily on week days.
Initial download of the metrics may take a while.