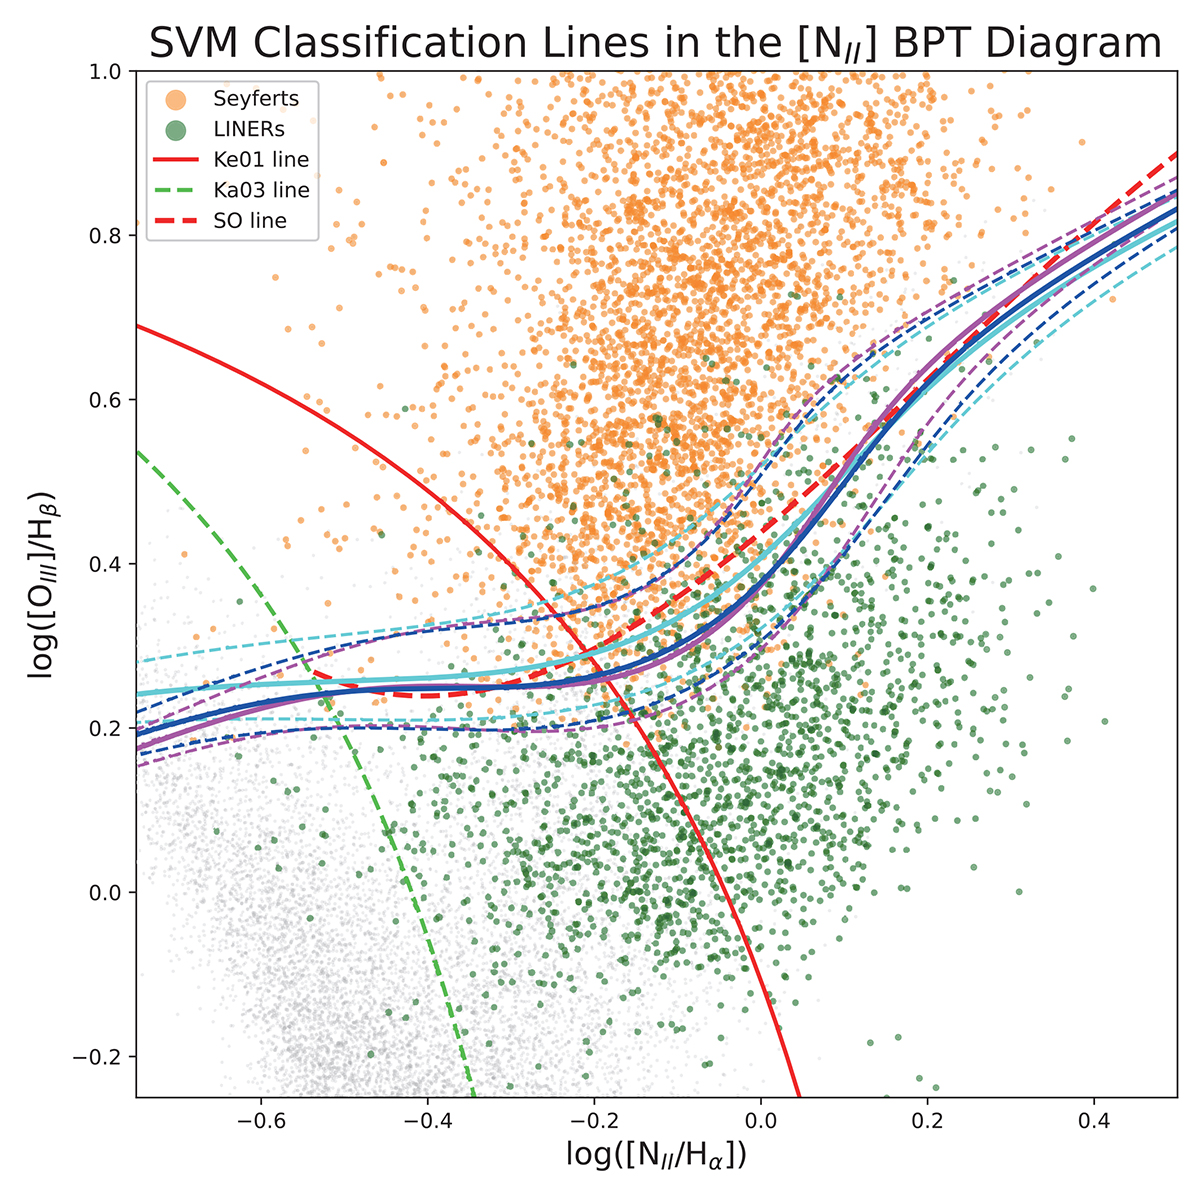
Fig. 10.
Download original image
Three SVM classification lines for Seyferts and LINERs in the [N II] BPT diagram. The solid orange and dark green circles represent the Seyferts and LINERs consistently classified in both the [S II] BPT diagram and the [O I] BPT diagram using Sample 1. The solid red line is the Ke01 line. The dashed green line is the Ka03 line. The dashed red line is the SO line. The solid blue, cyan, and magenta lines represent the SVM classification lines obtained using Samples 1, 3, and 4, respectively. The dashed lines of the corresponding color represent the upper and lower boundaries of margins.
Current usage metrics show cumulative count of Article Views (full-text article views including HTML views, PDF and ePub downloads, according to the available data) and Abstracts Views on Vision4Press platform.
Data correspond to usage on the plateform after 2015. The current usage metrics is available 48-96 hours after online publication and is updated daily on week days.
Initial download of the metrics may take a while.