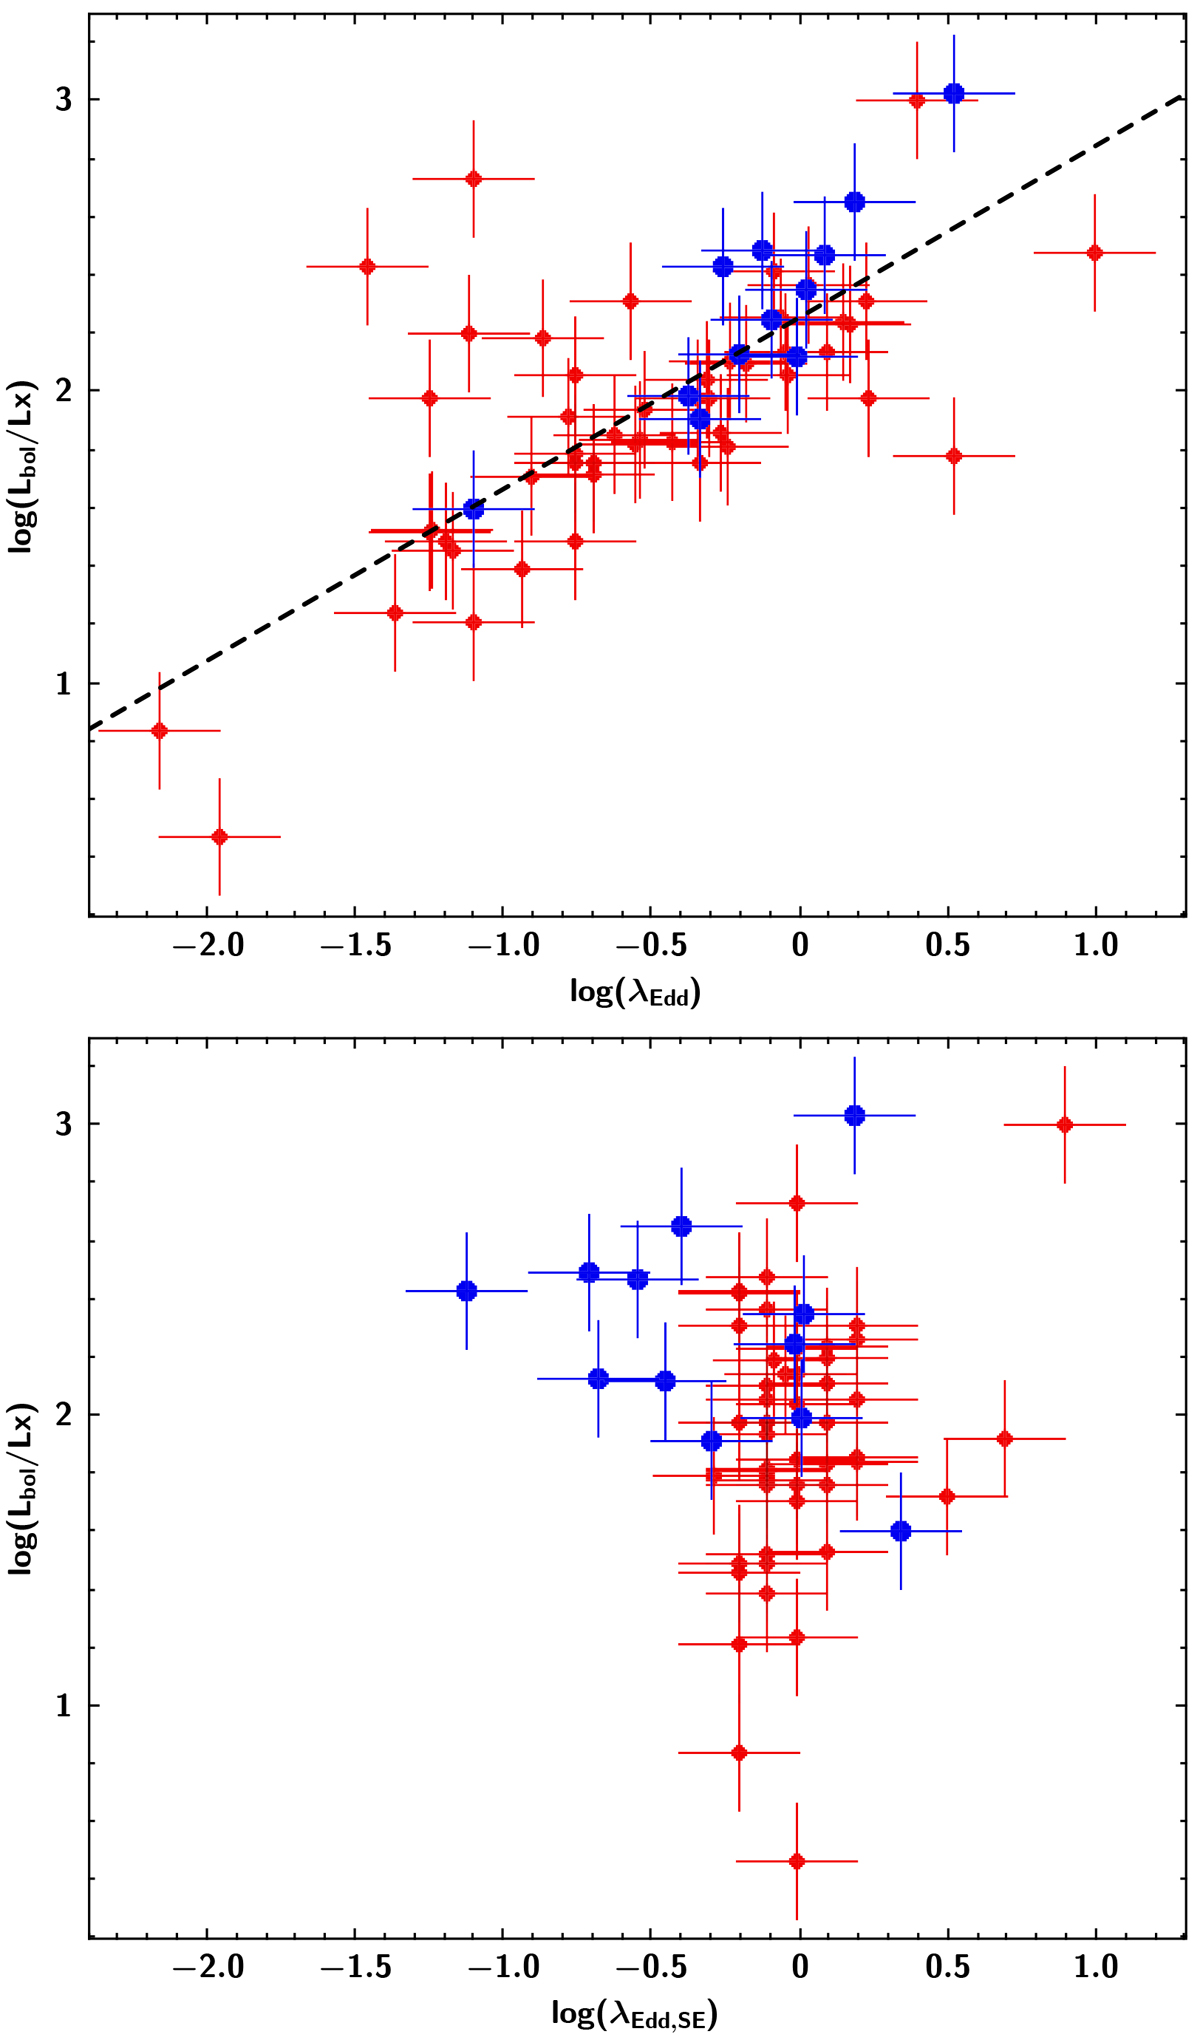
Fig. 7.
Download original image
Top panel: Logarithm of the X-ray bolometric correction factor log(Lbol/LX) plotted vs. log(λEdd), where the latter is computed using the X-ray scaling method. The dashed line represents the best fit including both the X-HESS sample (red diamonds) and the WISSH sample (blue circles), KX=(2.26±0.01)+(0.59±0.01)×log(λEdd). Bottom panel: Same plot with log(λEdd) derived using SE measurements. No significant correlation is obtained.
Current usage metrics show cumulative count of Article Views (full-text article views including HTML views, PDF and ePub downloads, according to the available data) and Abstracts Views on Vision4Press platform.
Data correspond to usage on the plateform after 2015. The current usage metrics is available 48-96 hours after online publication and is updated daily on week days.
Initial download of the metrics may take a while.