Fig. 8.
Download original image
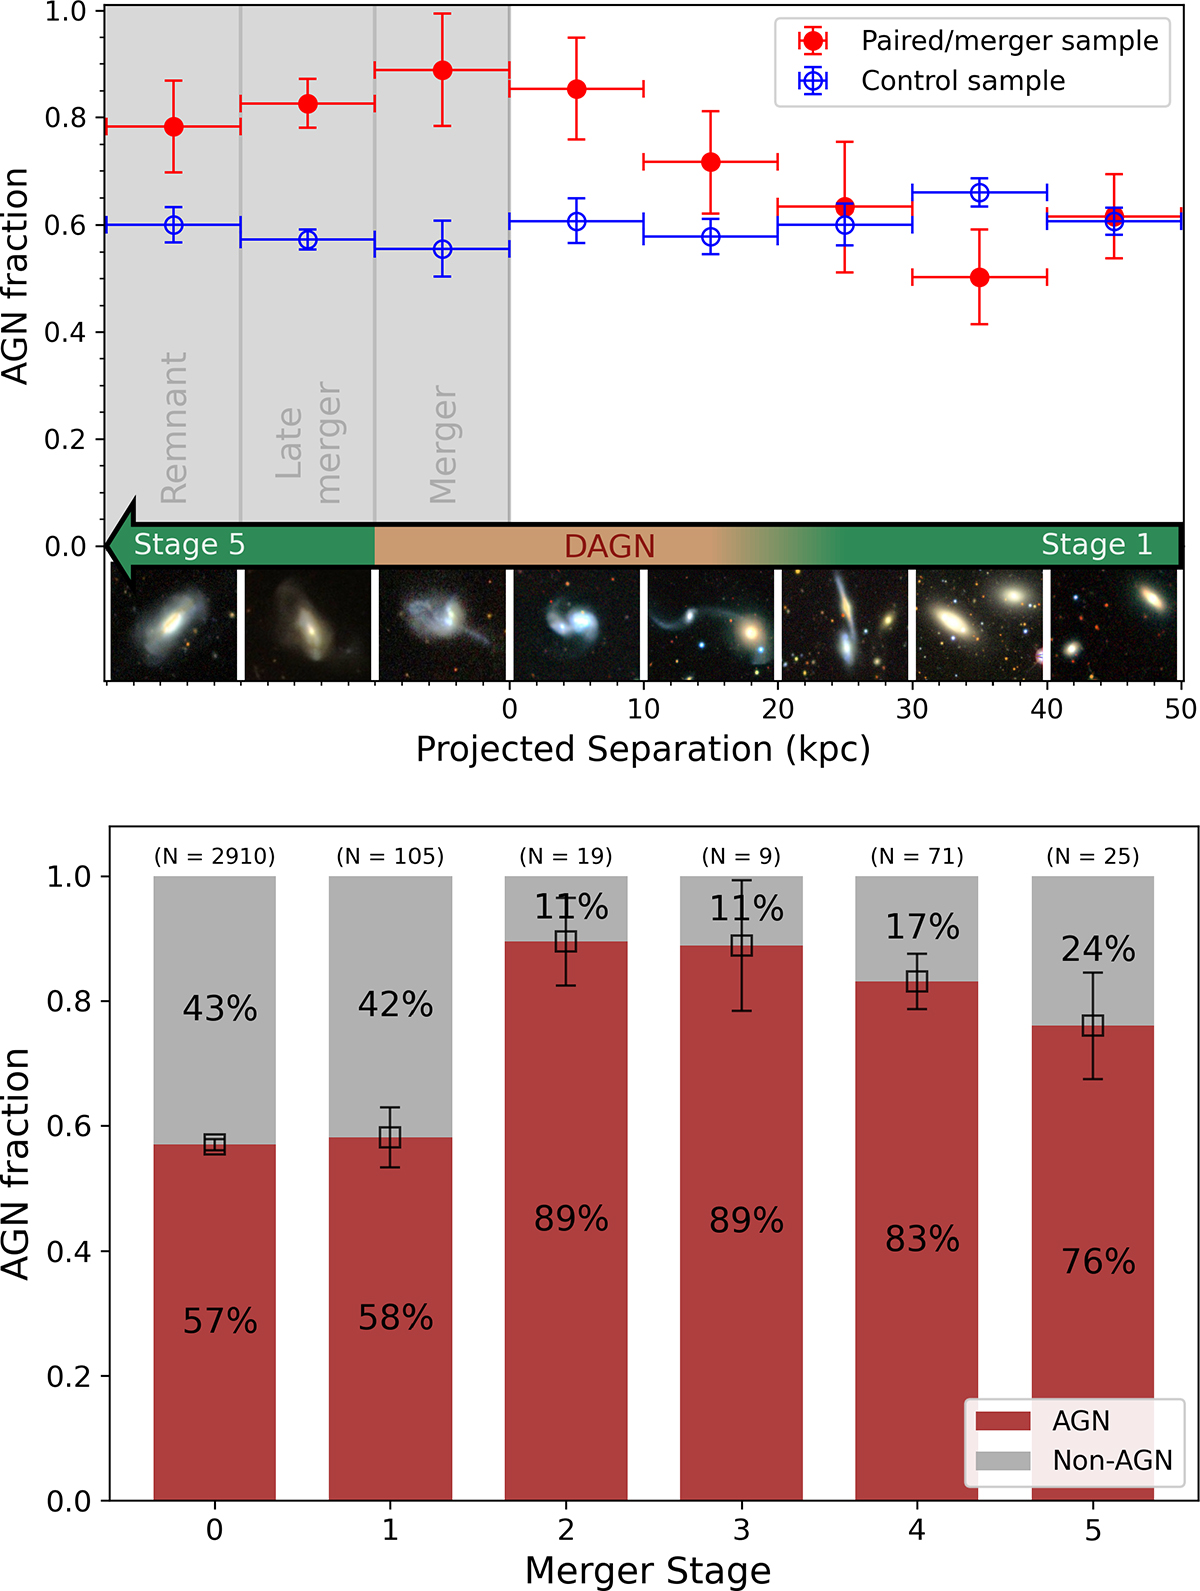
Top panel: AGN fraction vs. the projected separation for the paired and merging galaxies sample (filled red points) and its control group (open blue points). The horizontal bars show the bin width, while the vertical bars show the binomial error of each bin. The gray bins at the left of the 0 kpc mark correspond to stages 3, 4, and 5 from right to left, respectively. The green arrow shows the direction of evolution of the merger process, and the orange region inside of it indicates the range in which we could expect to find dual AGNs (we note that the right end is a gradient, since the condition of being a dual AGN will depend on the applied definition and more factors than only the projected separation). The galaxy images below the arrow are representative examples of the corresponding bin. We note that stages 1 and 2 are mixed in the projected separation region. Bottom panel: AGN fraction at each merger stage, shown as a percentage. The error bars show the binomial error of each bin. The numbers on top indicate how many AGNs are in the corresponding bin. We note that the AGN fraction for stages 3–5 might slightly vary from the top plot because a few galaxies were excluded from it, since they did not have a valid value for the Void criterion and hence could not be matched to control galaxies.
Current usage metrics show cumulative count of Article Views (full-text article views including HTML views, PDF and ePub downloads, according to the available data) and Abstracts Views on Vision4Press platform.
Data correspond to usage on the plateform after 2015. The current usage metrics is available 48-96 hours after online publication and is updated daily on week days.
Initial download of the metrics may take a while.