Fig. 7.
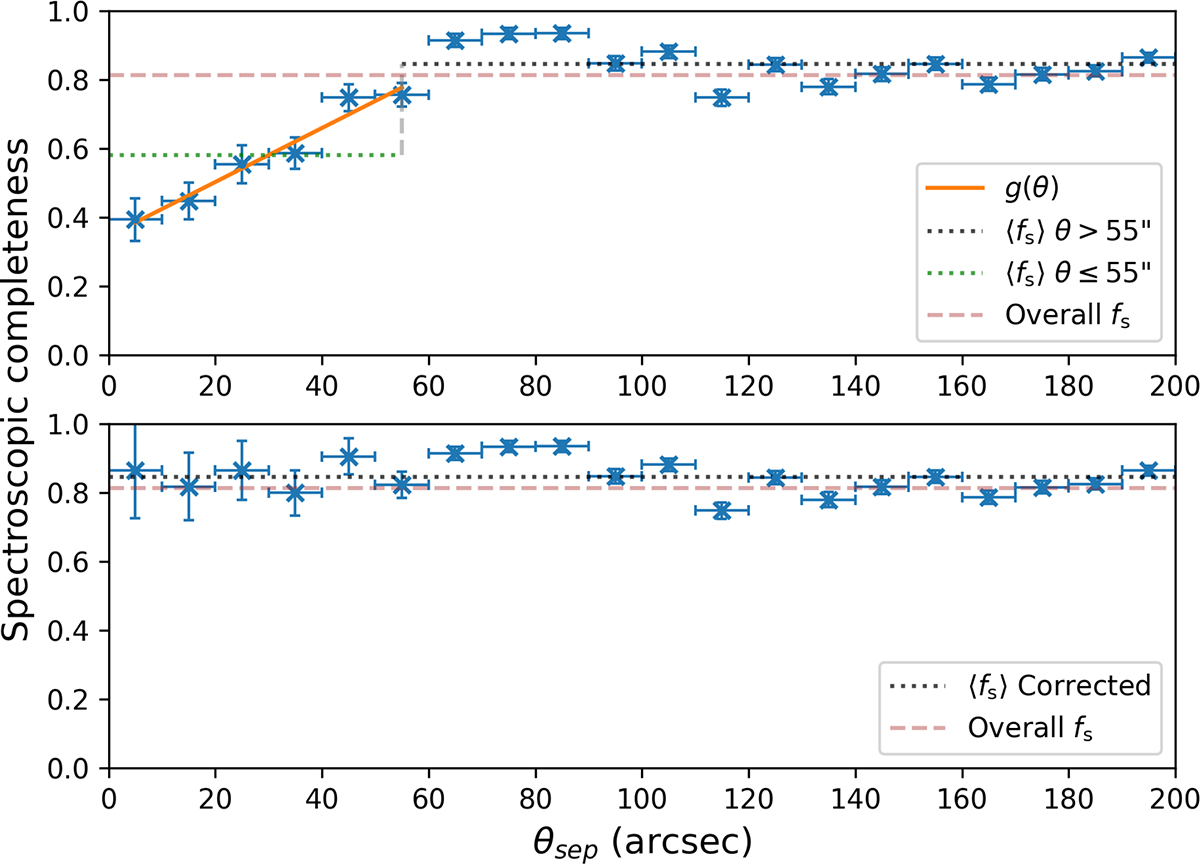
Download original image
Spectroscopic completeness vs. angular separation for the SDSS DR18 and NSA combined. Top: Data before applying the weight correction. The spectroscopic completeness noticeably decreases from θ = 55″ to smaller separations, while for θ>55″ it converges toward the overall spectroscopic completeness (fs≈0.83). The solid orange line shows the fit to the data below θ = 55″. To improve the fitting quality and reduce error sizes, we used 10″ wide bins. Consequently, we also include a few galaxies between 55″ and 60″ for the fitting. Bottom: Data after applying the weight correction. The spectroscopic completeness was computed in the same way as in Fig. 5. The error bars were computed by error propagation.
Current usage metrics show cumulative count of Article Views (full-text article views including HTML views, PDF and ePub downloads, according to the available data) and Abstracts Views on Vision4Press platform.
Data correspond to usage on the plateform after 2015. The current usage metrics is available 48-96 hours after online publication and is updated daily on week days.
Initial download of the metrics may take a while.