Fig. 2.
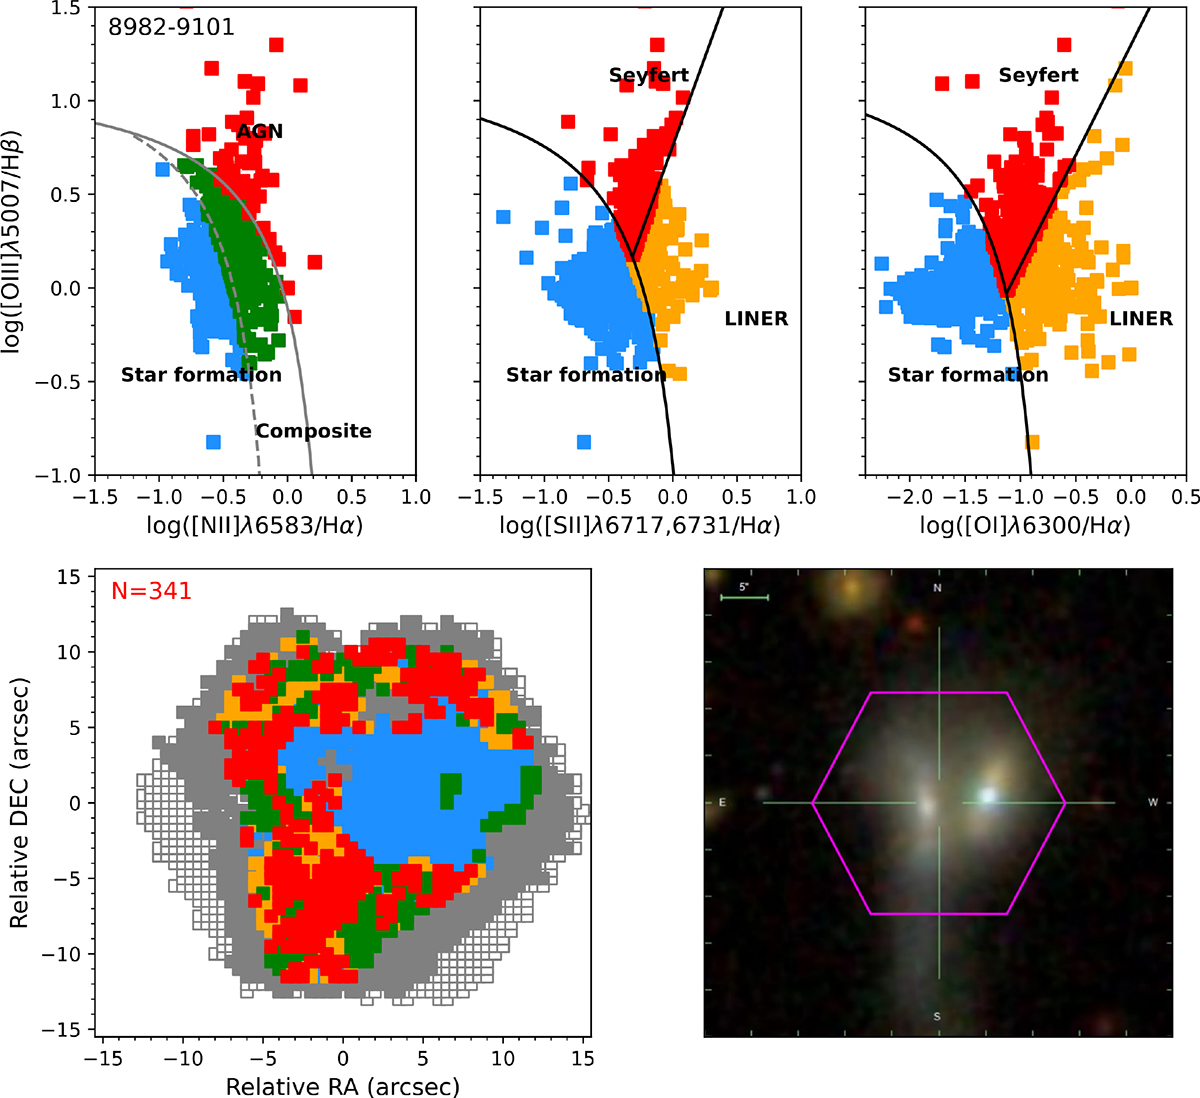
Download original image
Analysis of MaNGA data of the AGN dwarf galaxy 8982-9101. Top row: Location of each MaNGA spaxel on the [NII]-BPT (left), [SII]-BPT (middle), and [OI]-BPT (right) used to distinguish between ionization by AGN (red spaxels), SF (blue spaxels), composite (green spaxels), and LINER (orange spaxels). Bottom left: Spatial distribution of the BPT-classified spaxels (color-coded as in the upper panels). Empty squares mark the IFU coverage, gray squares those spaxels with continuum signal-to-noise ratio S/N≥1. The red “N” indicates the number of AGN spaxels. Bottom right: SDSS composite image. The pink hexagon shows the MaNGA field of view.
Current usage metrics show cumulative count of Article Views (full-text article views including HTML views, PDF and ePub downloads, according to the available data) and Abstracts Views on Vision4Press platform.
Data correspond to usage on the plateform after 2015. The current usage metrics is available 48-96 hours after online publication and is updated daily on week days.
Initial download of the metrics may take a while.