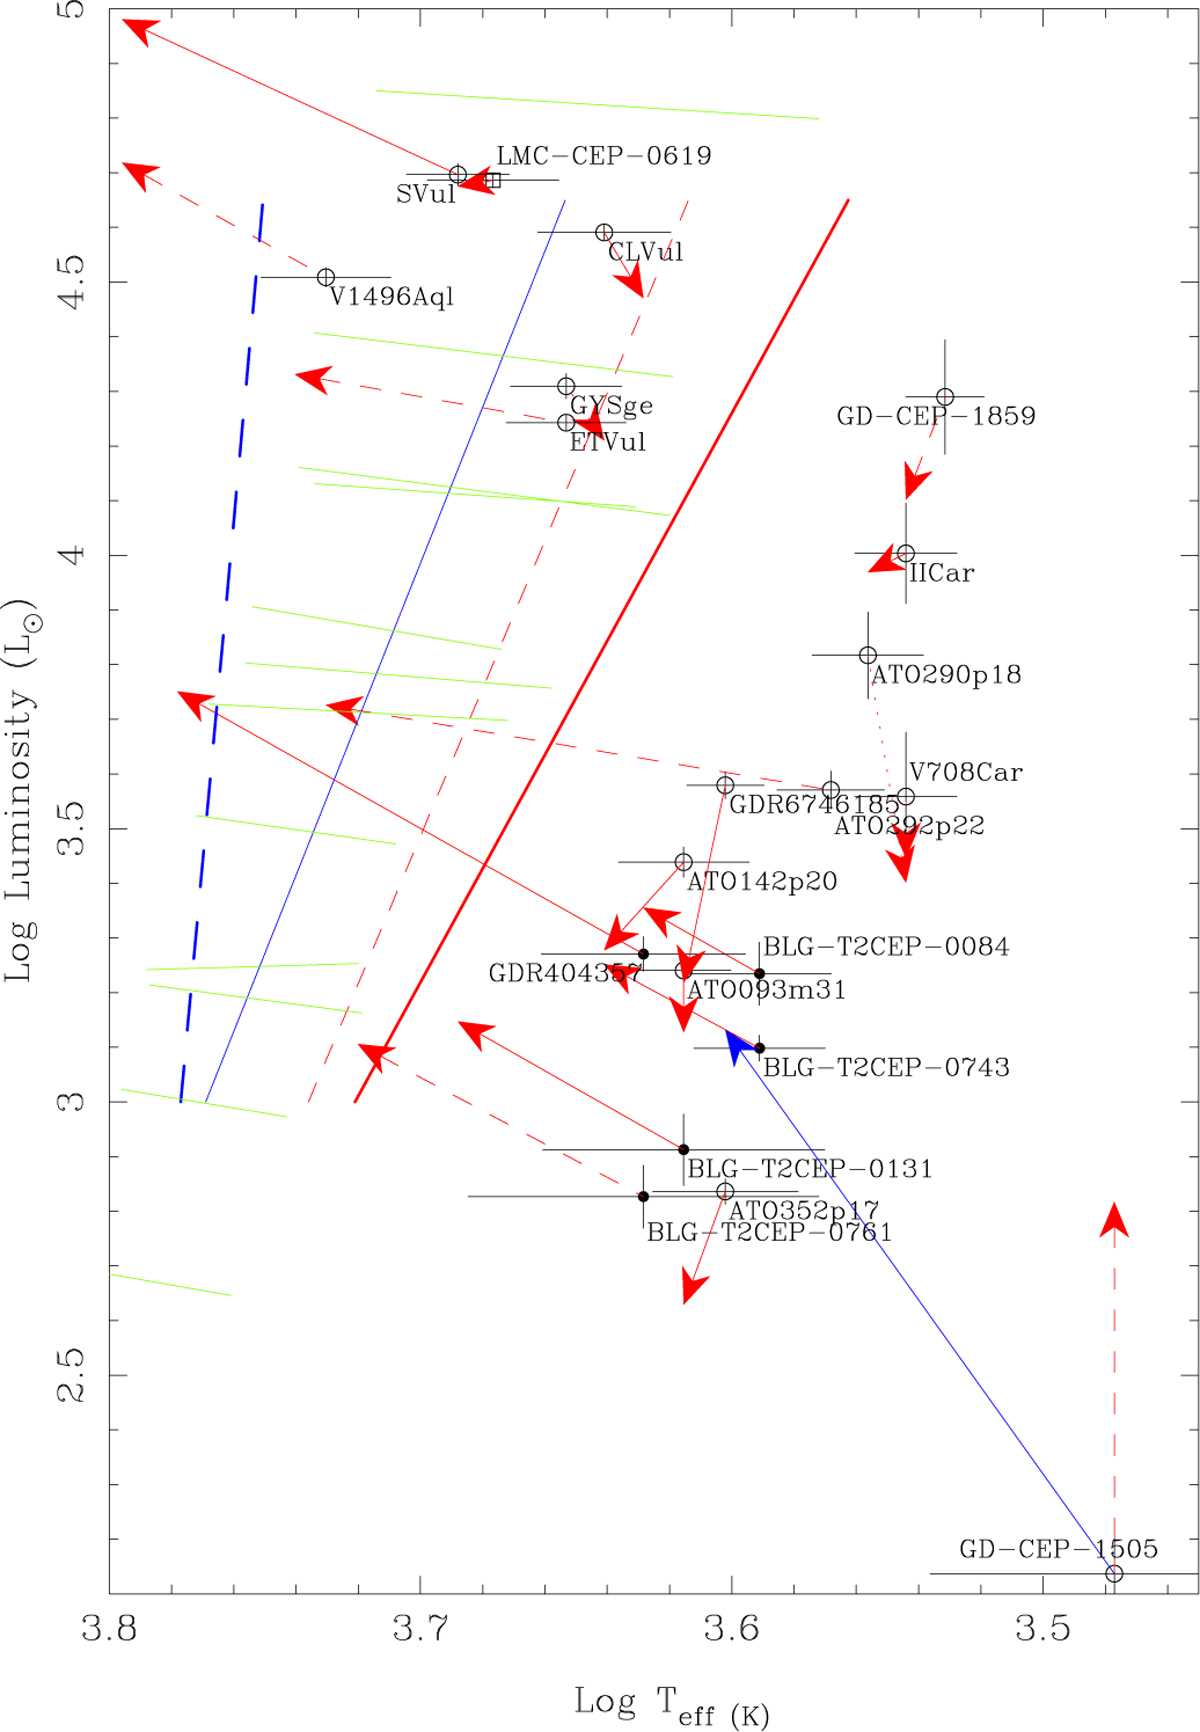
Fig. 4
Download original image
Hertzsprung-Russell diagram. The symbols and lines largely follow Fig. 2. The standard models are connected to the best-fitting alternative models (i.e. with dust or alternative distances and reddenings) by a red line with arrow. The arrow is dashed when the alternative model has a reduced χ2 that is lower by 10% or more than that of the standard model, dot-dashed when the alternative model has a reduced χ2 that is larger by 10% or more, and solid otherwise. The blue line for GD-CEP-1505 indicates yet another alternative model (see text).
Current usage metrics show cumulative count of Article Views (full-text article views including HTML views, PDF and ePub downloads, according to the available data) and Abstracts Views on Vision4Press platform.
Data correspond to usage on the plateform after 2015. The current usage metrics is available 48-96 hours after online publication and is updated daily on week days.
Initial download of the metrics may take a while.