Fig. 3
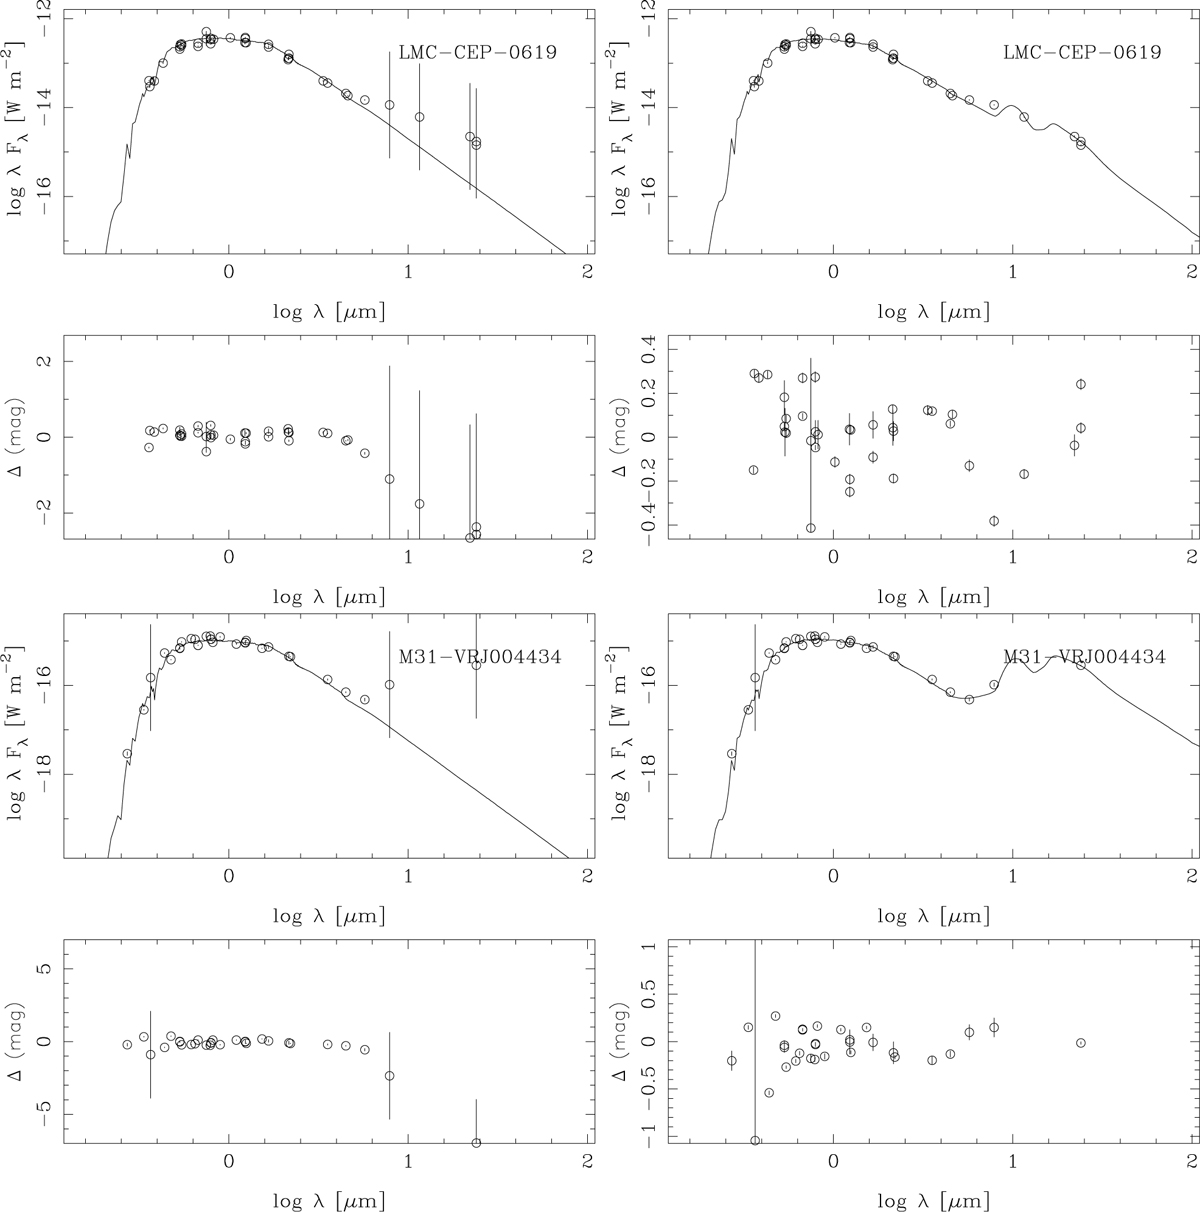
Download original image
Examples of best-fitting models assuming dust (right) compared to no dust (left panels). We note the difference in the range of the ordinate in the left and right bottom panels. The other six objects are shown in Fig. C.1. In the models without dust some photometric points are considered outliers and are plotted with a large error bar, instead of omitting them.
Current usage metrics show cumulative count of Article Views (full-text article views including HTML views, PDF and ePub downloads, according to the available data) and Abstracts Views on Vision4Press platform.
Data correspond to usage on the plateform after 2015. The current usage metrics is available 48-96 hours after online publication and is updated daily on week days.
Initial download of the metrics may take a while.