Fig. 6.
Download original image
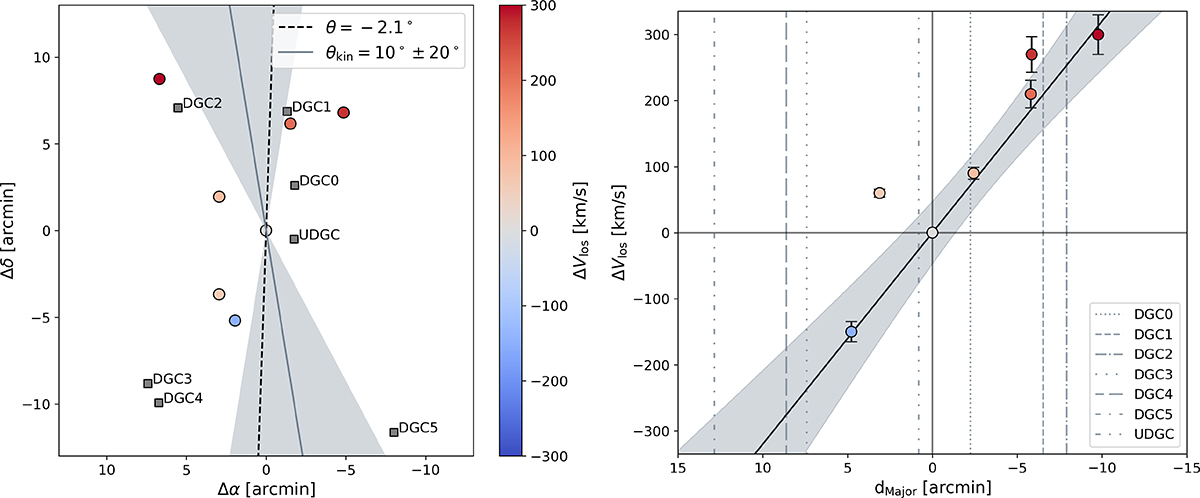
Phase-space diagrams of the NGC 2750 system. Left: Spatial distribution of known members (circles) and candidates (squares) coloured (when measurements are available) according to their difference in line-of-sight velocity from that of the central host. Right: line-of-sight velocity difference as a function of the on-sky distance along the major axis (dMajor); the solid black lines is the best fit of the rotational model with the 1σ confidence interval, while the discontinuous vertical lines represent the dMajor values of the DGCs.
Current usage metrics show cumulative count of Article Views (full-text article views including HTML views, PDF and ePub downloads, according to the available data) and Abstracts Views on Vision4Press platform.
Data correspond to usage on the plateform after 2015. The current usage metrics is available 48-96 hours after online publication and is updated daily on week days.
Initial download of the metrics may take a while.