Fig. 5.
Download original image
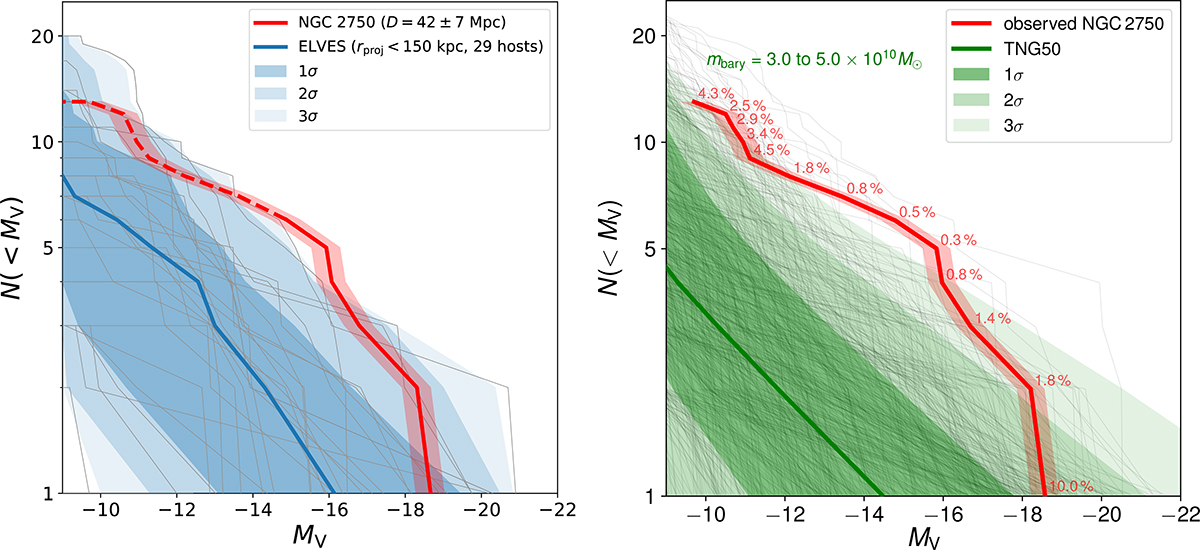
Luminosity function of the NGC 2750 system compared with those of observed and simulated systems. Left: comparison with the observed systems studied by the ELVES survey (gray lines). Values for the NGC 2750 system are marked with a red line, with the dashed part indicating the values of the DGCs, while the shaded area accounts for the distance uncertainty. The blue line represents the median distribution of the ELVES survey, with the shaded areas being the 1, 2, and 3σ confidence intervals. The lower MV limit coincides with the ELVES survey completeness limit of −9 mag (Carlsten et al. 2022). Right: comparison with the simulated systems selected from TNG50 (gray lines). Again, the green line represents the median distribution, with the shaded areas being the 1, 2, and 3σ intervals.
Current usage metrics show cumulative count of Article Views (full-text article views including HTML views, PDF and ePub downloads, according to the available data) and Abstracts Views on Vision4Press platform.
Data correspond to usage on the plateform after 2015. The current usage metrics is available 48-96 hours after online publication and is updated daily on week days.
Initial download of the metrics may take a while.