Open Access
Fig. 3.
Download original image
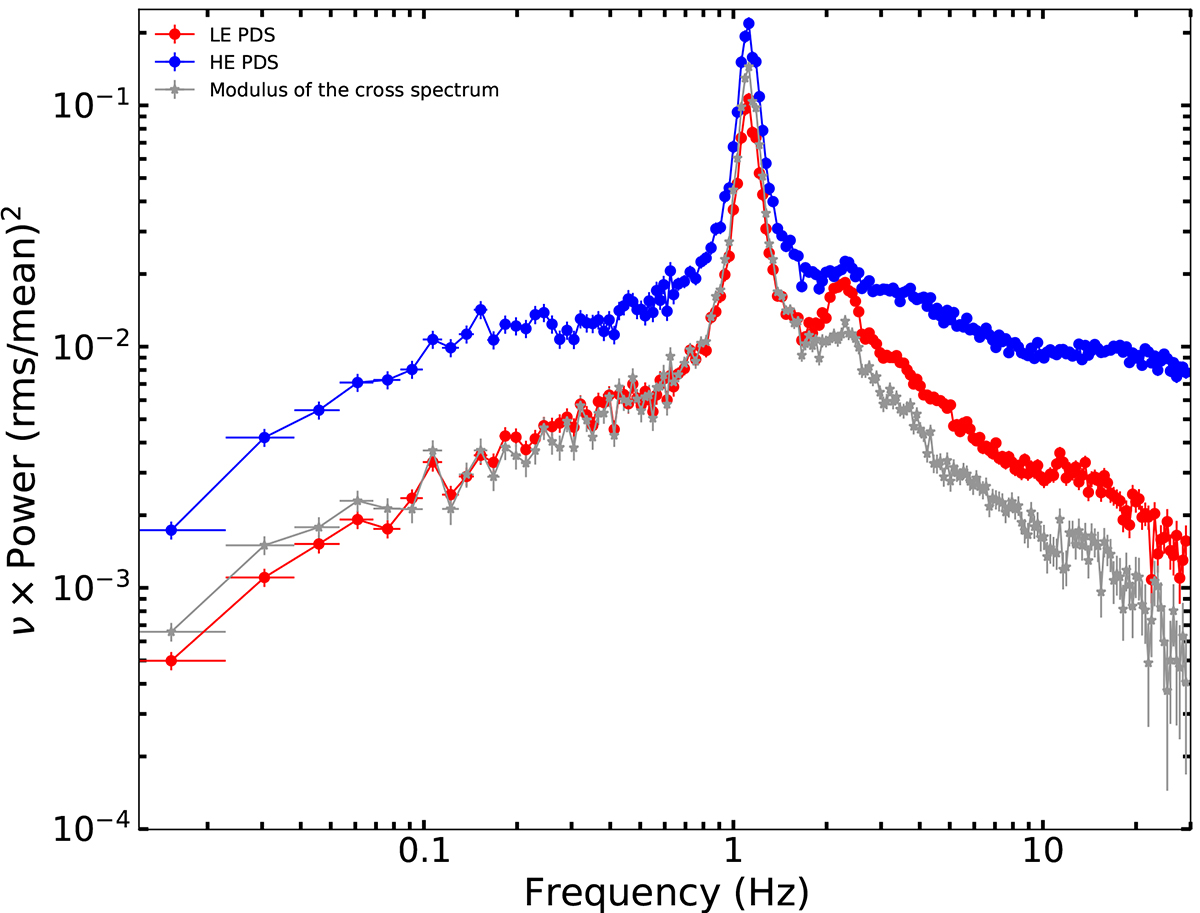
Representative power spectra and cross spectrum of Swift J1727.8–1613 in the normal state. The LE 2–10 keV PDS (red), the HE 28–200 keV PDS (blue), and the modulus of the cross spectrum of the HE data with respect to the LE data (gray), corresponding to the observations between the black dotted vertical lines in Fig. 2.
Current usage metrics show cumulative count of Article Views (full-text article views including HTML views, PDF and ePub downloads, according to the available data) and Abstracts Views on Vision4Press platform.
Data correspond to usage on the plateform after 2015. The current usage metrics is available 48-96 hours after online publication and is updated daily on week days.
Initial download of the metrics may take a while.