Fig. 6
Download original image
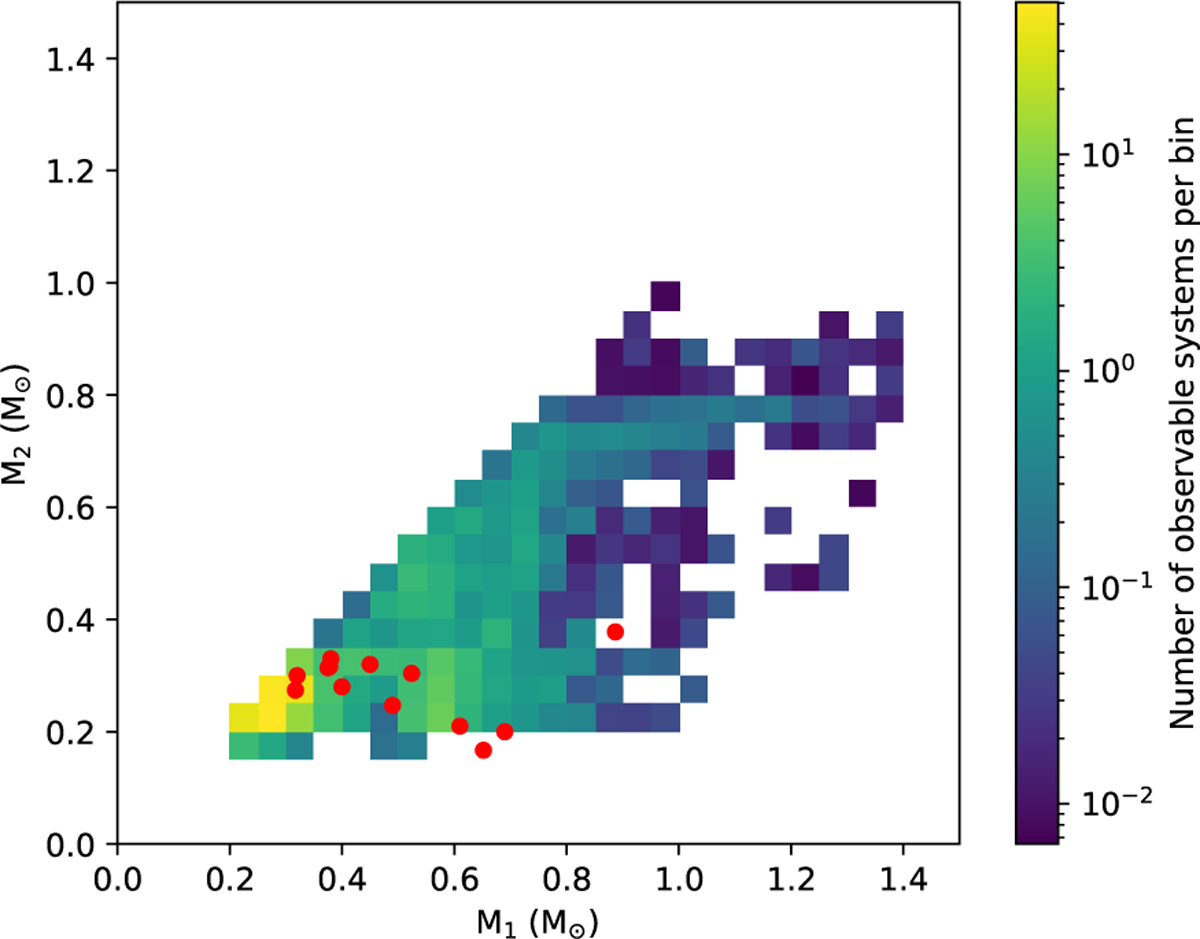
Comparison of the component masses of the DWDs in the SEBA population with an r-band magnitude limit of 20.5 to the observed ZTF population. Each rectangular cell represents a mass bin and is shaded according to the number of systems SEBA predicts for that bin (corrected for the magnitude limit, the probability of eclipsing, and the ZTF sky coverage). Each red dot is an observed system. Here, we take M1 to always be the more massive of the WDs in the binary.
Current usage metrics show cumulative count of Article Views (full-text article views including HTML views, PDF and ePub downloads, according to the available data) and Abstracts Views on Vision4Press platform.
Data correspond to usage on the plateform after 2015. The current usage metrics is available 48-96 hours after online publication and is updated daily on week days.
Initial download of the metrics may take a while.