Fig. 4
Download original image
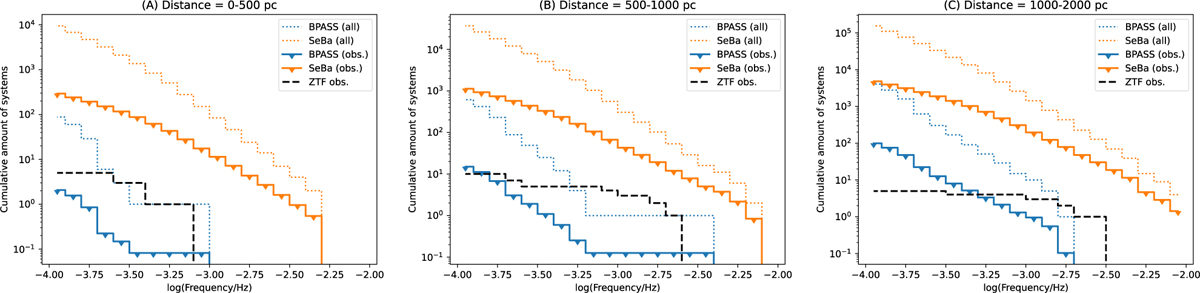
Cumulative sum of the number of DWDs per frequency bin in the model populations compared to the observed population from ZTF, for several distance ranges. The cumulative sum is calculated for binaries in the frequency range of 10−4 to 10−2 Hz, starting at the high-frequency end. For the models, the dotted lines represent the total numbers of DWDs while the solid lines indicate the numbers of DWDs corrected to account for observational biases, providing an estimate of how many DWDs would be detectable in EM, though these are still upper limits.
Current usage metrics show cumulative count of Article Views (full-text article views including HTML views, PDF and ePub downloads, according to the available data) and Abstracts Views on Vision4Press platform.
Data correspond to usage on the plateform after 2015. The current usage metrics is available 48-96 hours after online publication and is updated daily on week days.
Initial download of the metrics may take a while.