Fig. 3
Download original image
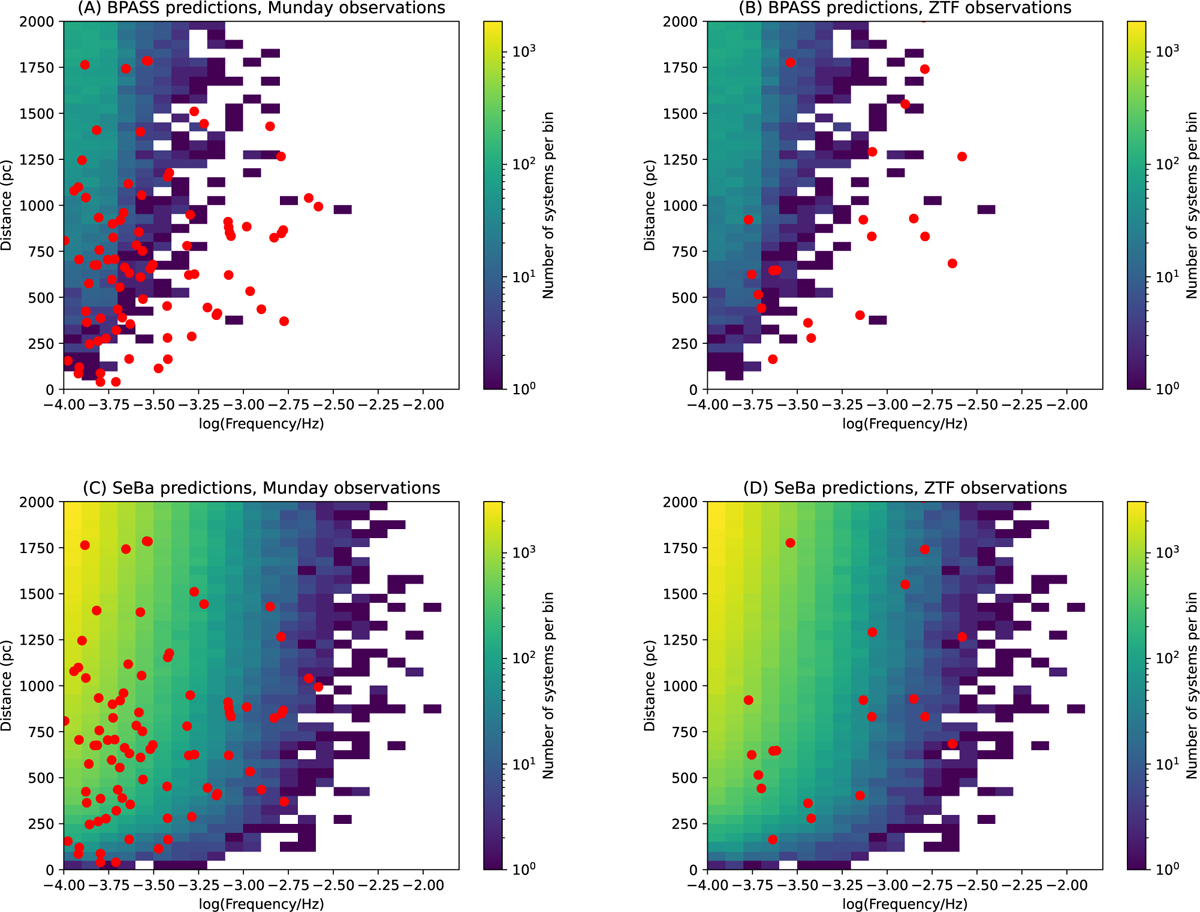
Comparison of the BPASS (panels A and B) and SEBA (panels C and D) model populations to the observed systems from the Munday dataset (panels A and C) and the ZTF dataset (panels B and D), in terms of the GW frequency and distance of the binaries. Each rectangular cell represents a frequency-distance bin and is shaded according to the number of systems the population synthesis model predicts for that bin; white indicates that zero systems are predicted. Each red dot is an observed system.
Current usage metrics show cumulative count of Article Views (full-text article views including HTML views, PDF and ePub downloads, according to the available data) and Abstracts Views on Vision4Press platform.
Data correspond to usage on the plateform after 2015. The current usage metrics is available 48-96 hours after online publication and is updated daily on week days.
Initial download of the metrics may take a while.