Fig. 2
Download original image
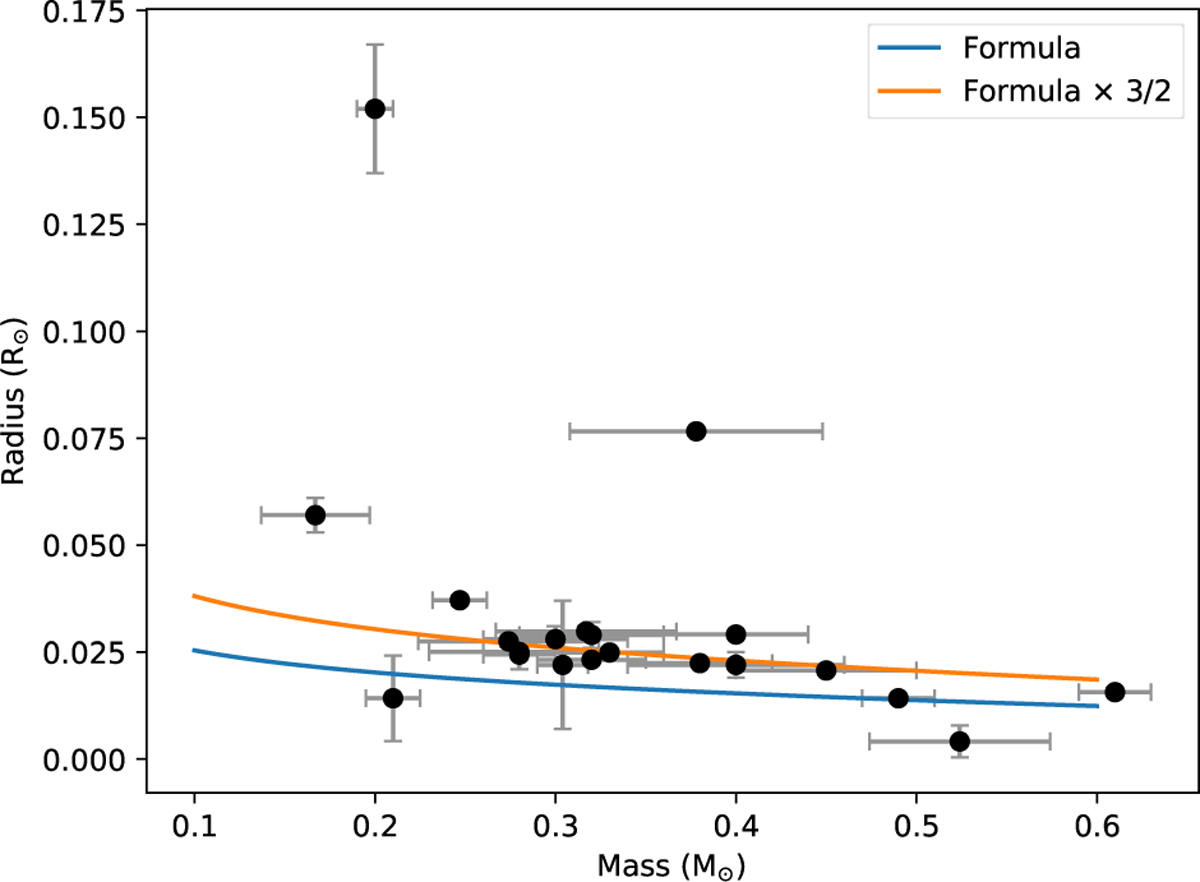
Comparison between the WD radii predicted by Eq. (2) and those of the WDs in the ZTF DWD dataset with both mass and radius listed. The black points represent the observed WDs, with measurement uncertainties. The blue line shows the radii as predicted by Eq. (2), and the orange line shows those radii multiplied by 3/2. The two outliers with the largest radii might be extremely low-mass WDs (Burdge et al. 2020b), or could be hot subdwarfs instead of WDs (Kosakowski et al. 2023b; Lin et al. 2024; Rebassa-Mansergas et al. 2024).
Current usage metrics show cumulative count of Article Views (full-text article views including HTML views, PDF and ePub downloads, according to the available data) and Abstracts Views on Vision4Press platform.
Data correspond to usage on the plateform after 2015. The current usage metrics is available 48-96 hours after online publication and is updated daily on week days.
Initial download of the metrics may take a while.