Fig. 4.
Download original image
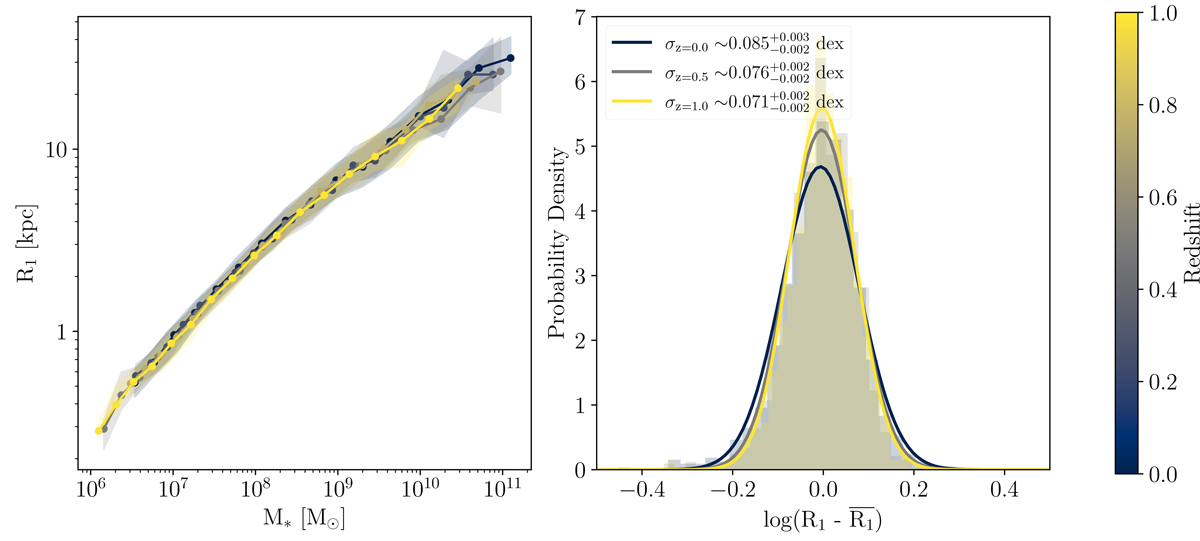
R1 as a function of galaxy stellar mass over redshift for all the galaxies in our sample, where the stellar mass is measured within 20% of R200. The left-hand panel shows the median value of the galaxy size, measured using the R1 criteria, for all simulations. Each colour represents a different redshift, from z = 0 (in blue) to z = 1 (in yellow). The median value of the size has been measured within 20 stellar mass bins in each case. We also show the 1σ error as shaded regions. The right-hand panel shows a normalised histogram of the scatter between each singular size value and its corresponding bin value, ![]() , for z = 0.0, z = 0.5, and z = 1 in blue, grey, and yellow, respectively. In every case, the global σ of the relation was found by fitting a Gaussian distribution (solid line following the same colour as the respective histogram). The respective σ was defined as the standard deviation of the respective Gaussian distribution, whose errors were computed via bootstrapping.
, for z = 0.0, z = 0.5, and z = 1 in blue, grey, and yellow, respectively. In every case, the global σ of the relation was found by fitting a Gaussian distribution (solid line following the same colour as the respective histogram). The respective σ was defined as the standard deviation of the respective Gaussian distribution, whose errors were computed via bootstrapping.
Current usage metrics show cumulative count of Article Views (full-text article views including HTML views, PDF and ePub downloads, according to the available data) and Abstracts Views on Vision4Press platform.
Data correspond to usage on the plateform after 2015. The current usage metrics is available 48-96 hours after online publication and is updated daily on week days.
Initial download of the metrics may take a while.